
My blogpost, Charting the Deep with Mermaid Chart AI, is a detailed narration of the following table:-
| Feature | Details |
|---|---|
| Tool Name | Mermaid Chart AI |
| Website | [mermaidchart.com](https://www.mermaidchart.com/) |
| Core Technology | Built on Mermaid.js (open-source diagramming syntax) |
| AI Capabilities | Prompt-to-diagram generation, AI chat for diagram creation |
| Diagram Types | Flowcharts, sequence diagrams, Gantt charts, ER diagrams, mindmaps, etc. |
| Editing Options | Text-based syntax and visual drag-and-drop editor |
| Collaboration | Real-time multi-user editing, comments, and sharing |
| Integrations | GitHub, Notion, Confluence, VS Code, and more |
| Use Cases | Developers, educators, analysts, product teams |
| Export Formats | PNG, SVG, PDF |
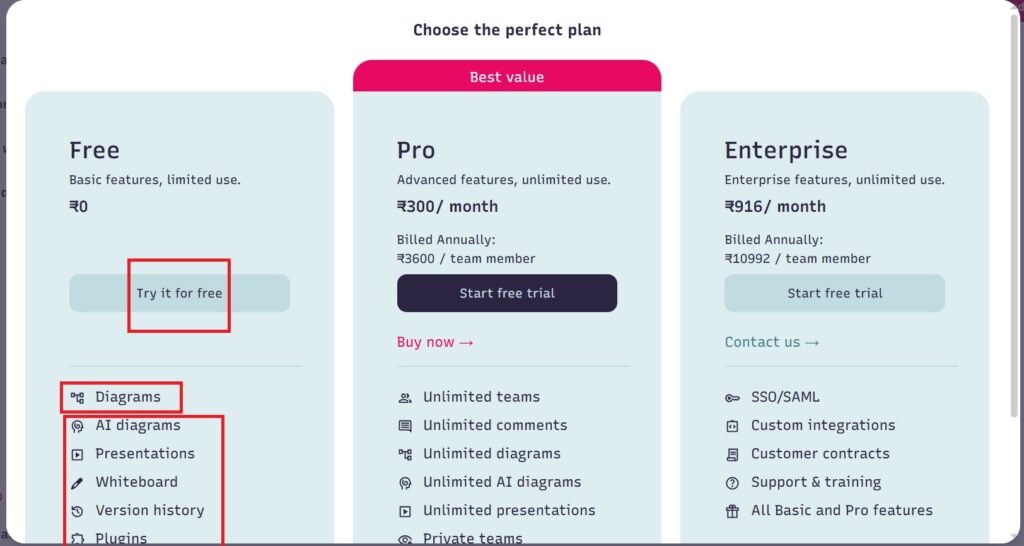
| Pricing Plans | Free, Pro ($10/month), Enterprise ($20/month) |
Introduction
- Mermaidchart.com is a AI powered tool to automate the process of drawing diagrams, which include Class diagrams, Flowcharts, Mind-maps, State diagrams, Entity-Relationship diagrams (ERDs) and many more.
- Now there is no need to create diagrams on software, from scratch, by including nodes, arrows, subgraphs, participants, messages, activation bars, classes, entities, attributes, relationships, visibility, root-nodes, branches etc.
- All the above elements are created accurately, automatically from the AI tool which show logical connections to create the required diagrams.
Importance of diagrams created from mermaidchart.com
- Diagrams like flowcharts, sequence diagrams, ERDs and others created with tools like mermaidchart.com are essential for clarity, communication and problem solving across many domains.
- The diagram created by mermaidchart.com breakdown intricate systems into individual components.
- They help people grasp relationships, workflows, and hierarchies quickly. The diagrams enhance communication by transcending language barriers and reduce ambiguity. Teams can align better when everyone sees the structure or process.
- You can create diagrams which boost productivity for developers, analysts and designs, save time by Diagrams serve a blue prints for coding, planning or decision-making.
- Diagrams created, make technical documentation more readable and engaging. They provide a snapshot of system architecture, user journeys and data models.
- Stake holders from different backgrounds(tech, business, design) can contribute meaningfully. Diagrams foster shared understanding, meetings reviews and brainstorming lessons.
- Flowcharts and sequence diagrams help chase logic errors or performance bottlenecks. ERDs and state diagrams reveal structural flaws and efficiencies.
- Educators use diagrams to explain abstract concepts. Learners retains more when information is presented visually.
- Earlier PlantUML was a open-source tool using plaintext to generate UML and other diagrams. Graphviz earlier used as a graph visualization software using DOT language.
- Draw.io is free online diagramming tool with drag and drop interface.
- These tools and many more laid the foundation for modern diagramming platforms like Mermaid Chart AI, with modern AI powered generation and markdown style simplicity.
- Tools like PlantUML and Graphviz pioneered the idea of generating diagrams from plain text. Mermaid Chart AI adopted and simplified this approach using markdown-style syntax, making it more accessible to non programmers.
- As the demand for diagrams is increasing, Mermaid Chart AI expanded this catalogue and added newer formats like C4 diagrams, mindmaps and user-journeys.
- Mermaid Chart AI embraced Web based rendering, GitHub integration and Markdown embedding, making diagrams portable.
- The latest updates from MermaidChart.com include the release of Mermaid 11.4 with Kanban diagram support, enhanced class diagram styling, and a major $7.5 million seed funding round. Kanban Diagrams help you see what needs to be done, what’s being worked on, and what’s finished. Great for managing projects, homework, chores, or team workflows.
Conclusion
- With the growing power of Artificial Intelligence, tools like Mermaid Chart AI, are a must for professionals, technology enthusiasts and educators.
- It helps save time, resources and effort and helps boosts productivity for all all kind of audiences.
- The quality and accuracy of the diagrams is indeed great which help gain knowledge and understand workflows.
- There are features to correct small and large basic logical errors by using the power of AI. It makes Mermaid Chart AI a must try.
How to use Mermaid Chart AI?
Charting the Deep with Mermaid Chart AI i.e. the process of using, Mermaid Chart AI is as follows:-
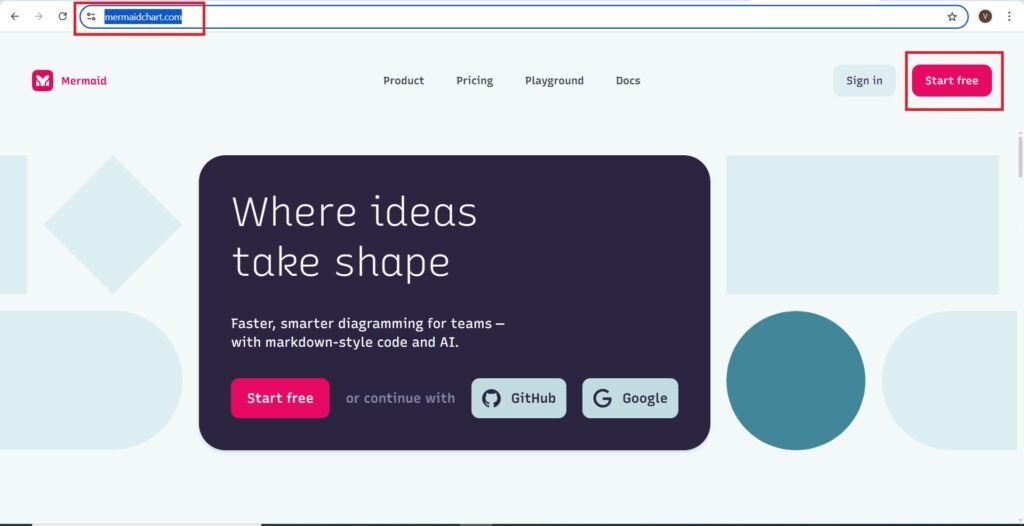
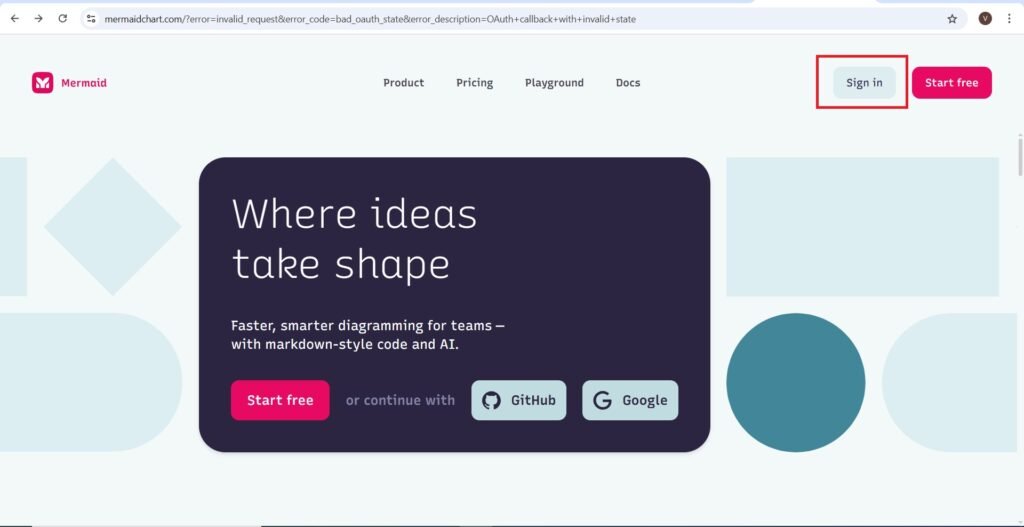
- Go to https://www.mermaidchart.com/.
- You will navigate to the following page—>
- Press—>Start free
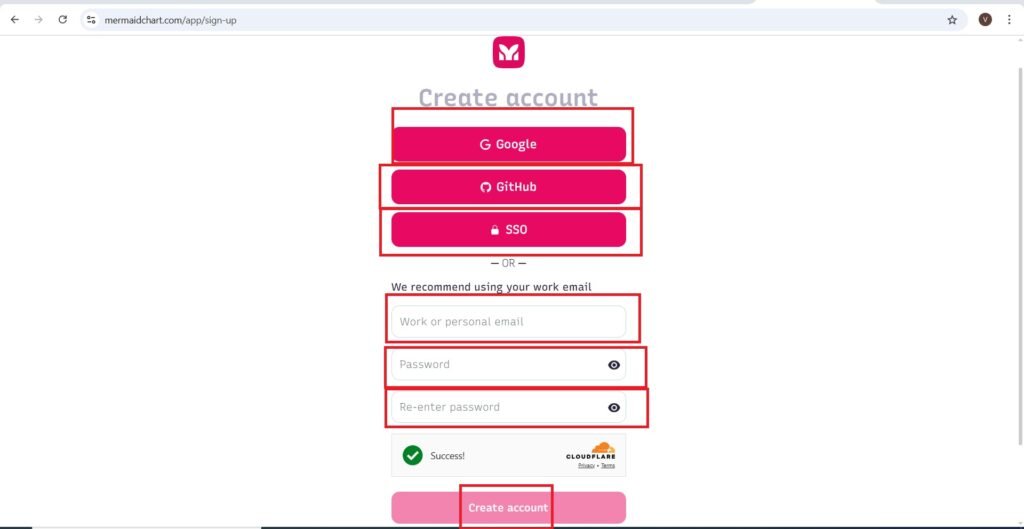
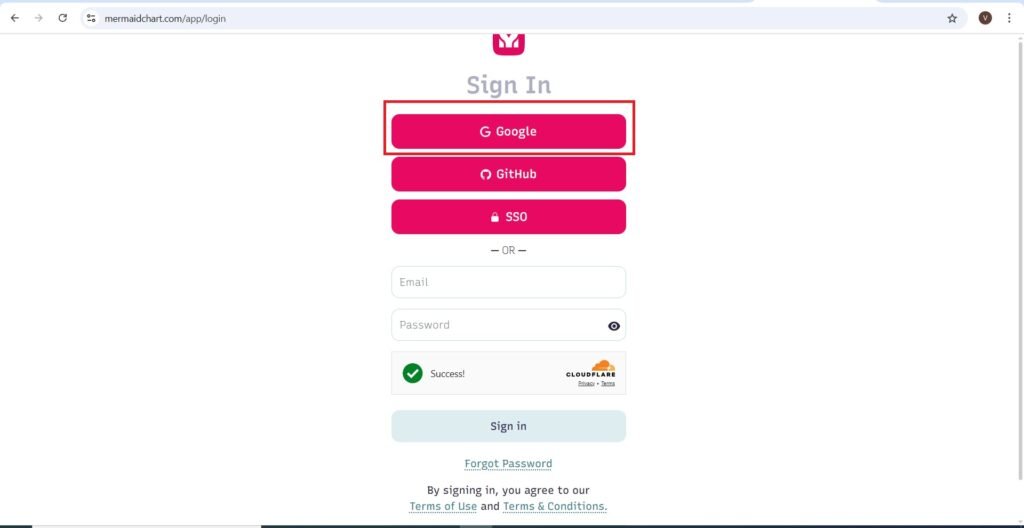
- You can create an account on the Mermaid Chart AI with Google, GitHub, SSO or your work email.
- For work email you have to create your password—>
- Press—>Create Account.
- Choose an account—>
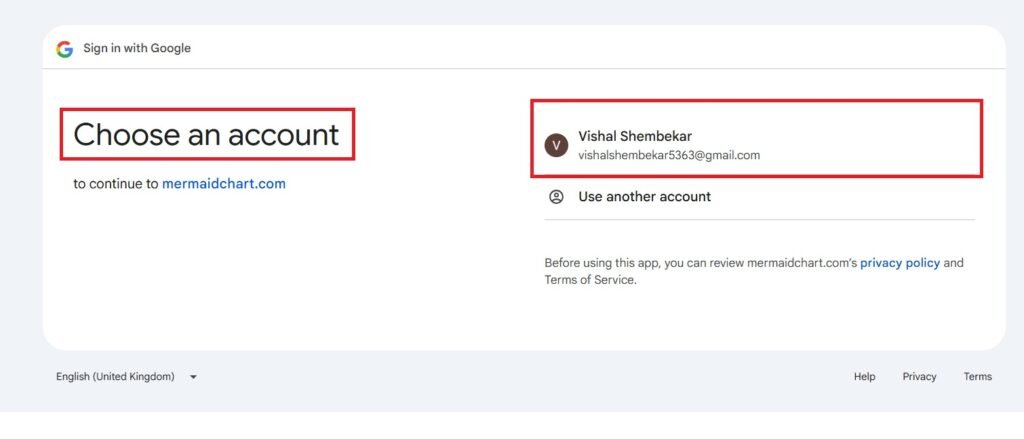
- Continue—>
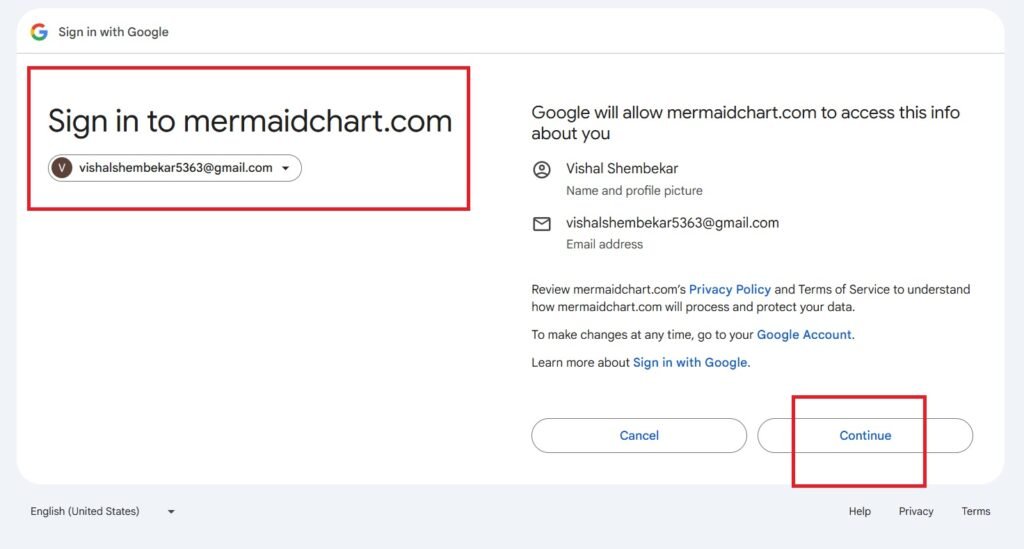
- Press—>Sign in
- I am using my Google Account—>
- Do the same steps as above to Sign in to your account—->
- You will navigate to the following page—>
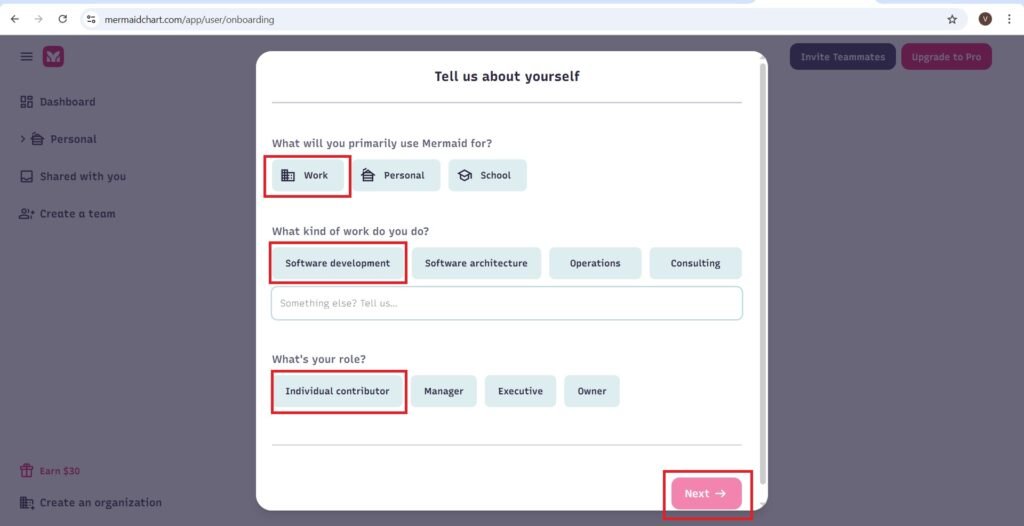
- Tell us about yourself—>
- Press—>Next
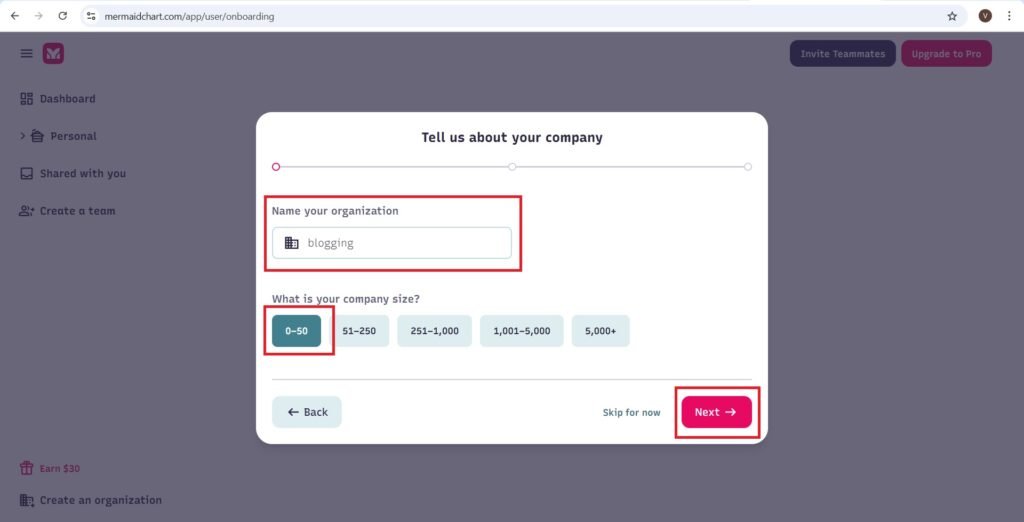
- Enter you Company name—>
- Enter the size of your company—>
- Press—>Next.
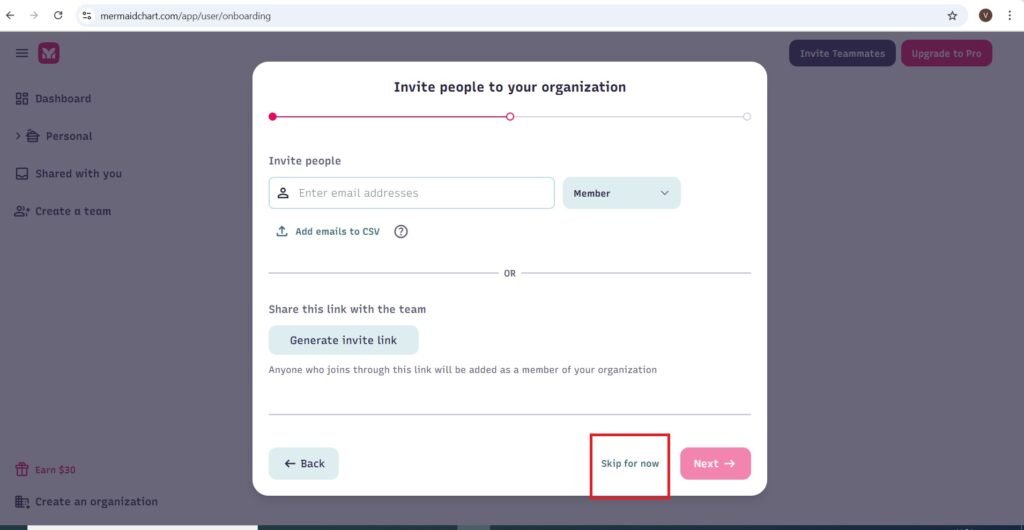
- You will navigate to the following page—>
- Press—>Skip for now
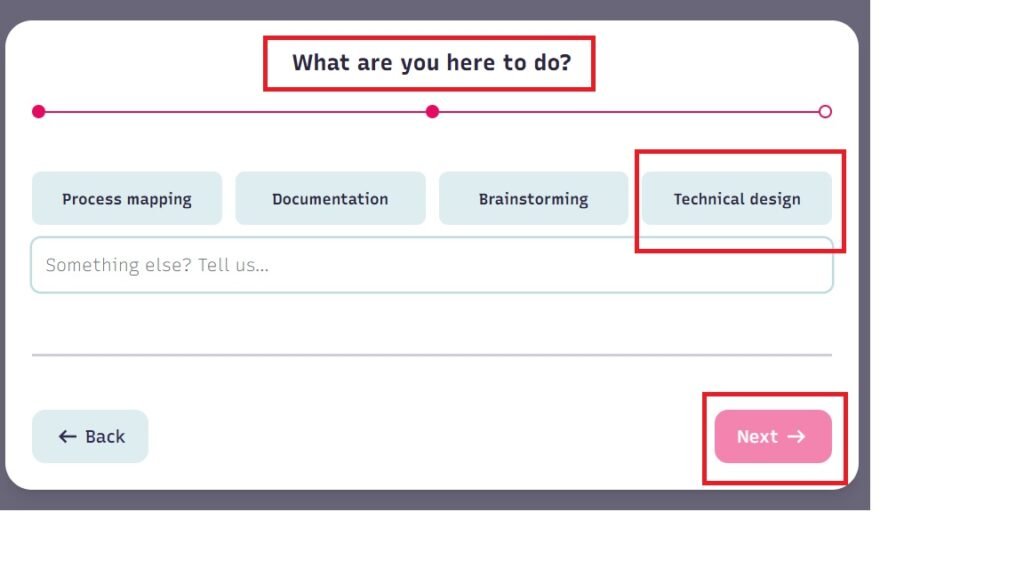
- What are you here to do—>
- select the option and Press—>Next
- Press—>Try it for free
- You will navigate to the following page—>
- You can Start a new diagram, Name your diagram, view all diagrams, construct flowcharts, class, sequence, Share, Upgrade, Edit code, Use AI to create diagrams.
- There are options like, Undo, Redo, Zoom out, Zoom in, Reset, Full screen.
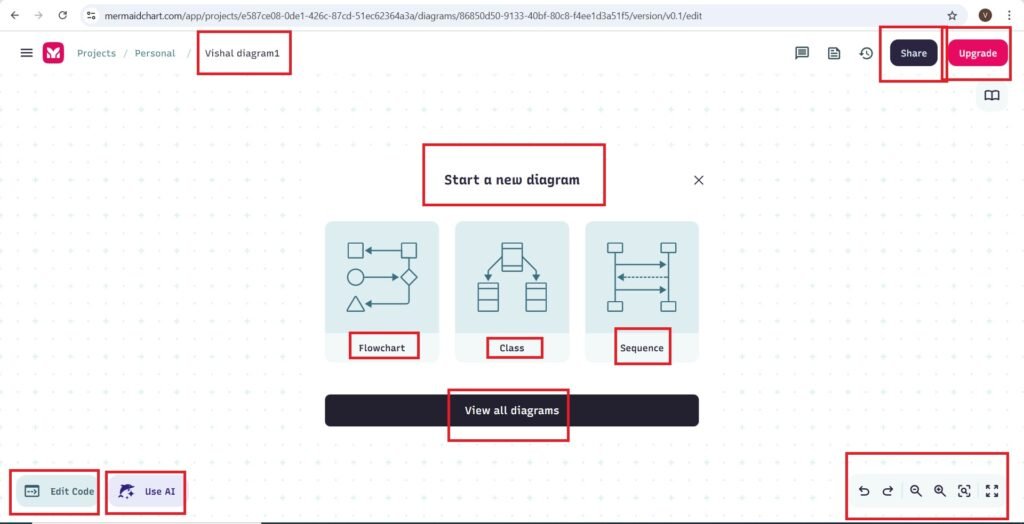
- I am creating a UML class diagram—>
- Press—>Class.
- You will navigate to the following page, and you will get the following diagram—>
- You can create your diagram on the page.
- The class diagram is as follows—>
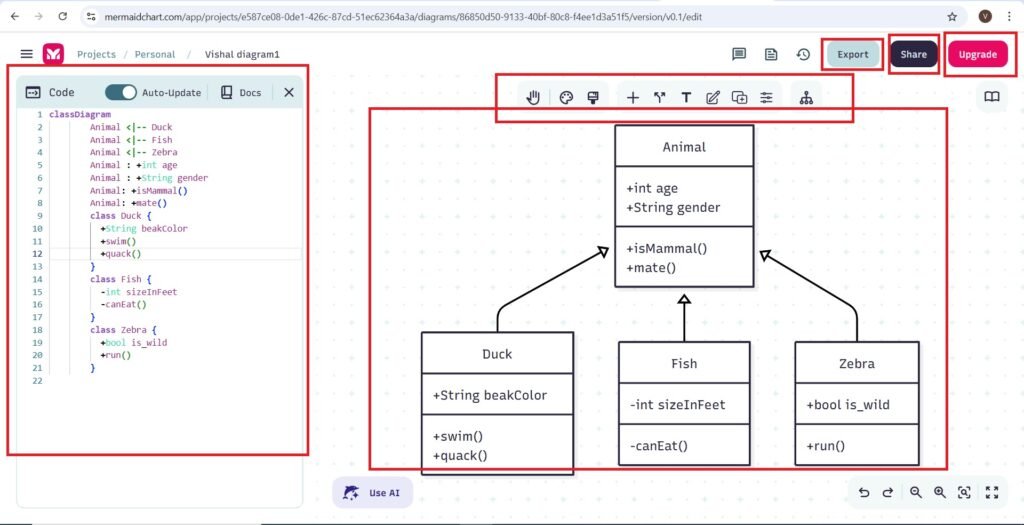
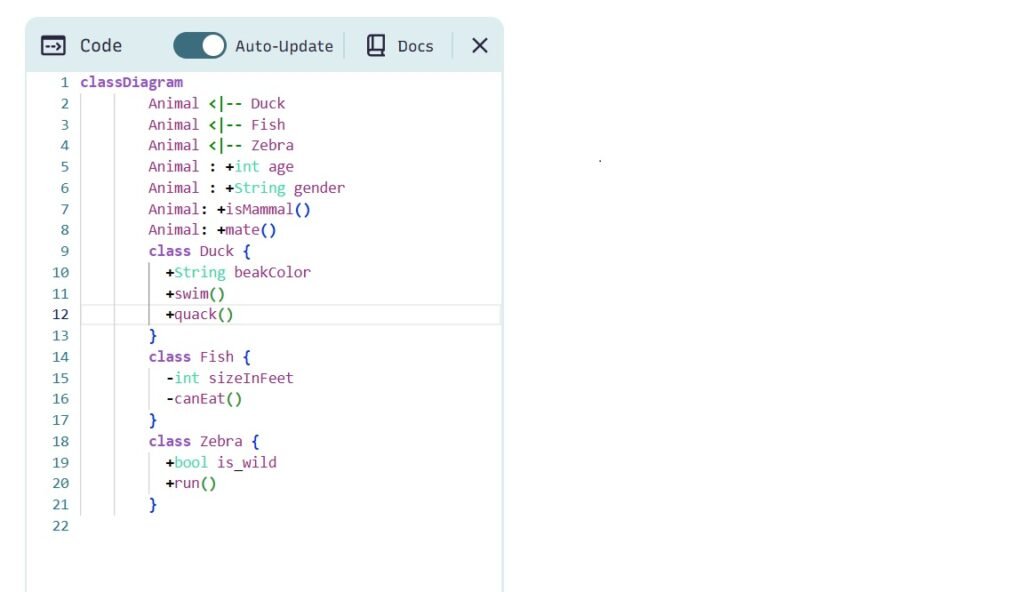
- The Code of the diagram is as follows—>
- You can edit it—>
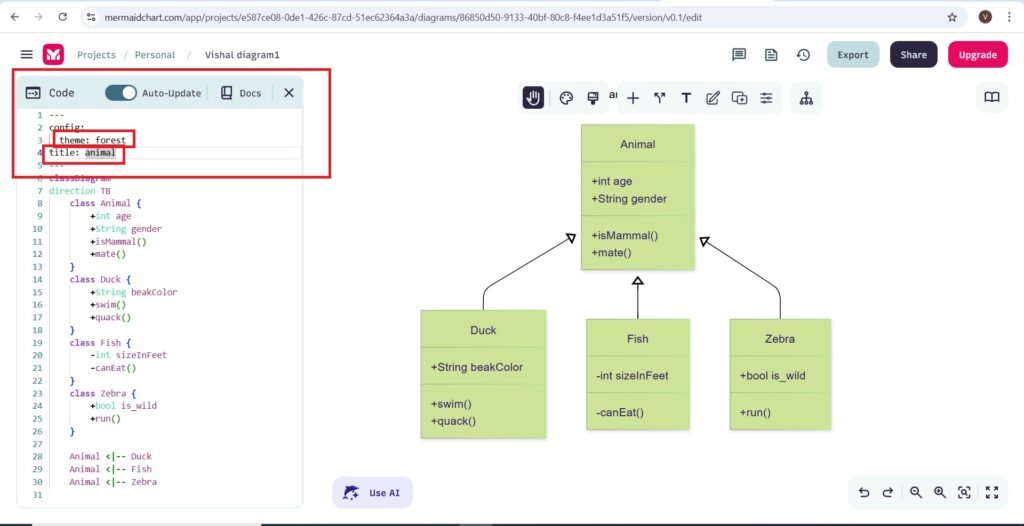
- There are plenty of editing options on the top of the class diagram, like, Pan, Theme, Look, Add class, change direction, Add title, Add note, Add namespace, Configuration, and Layout.
- After using some of the editing options on the top of the class diagram like, pan, theme, and title, code is as follows—>
- Pan option is used to change the background of the class diagram
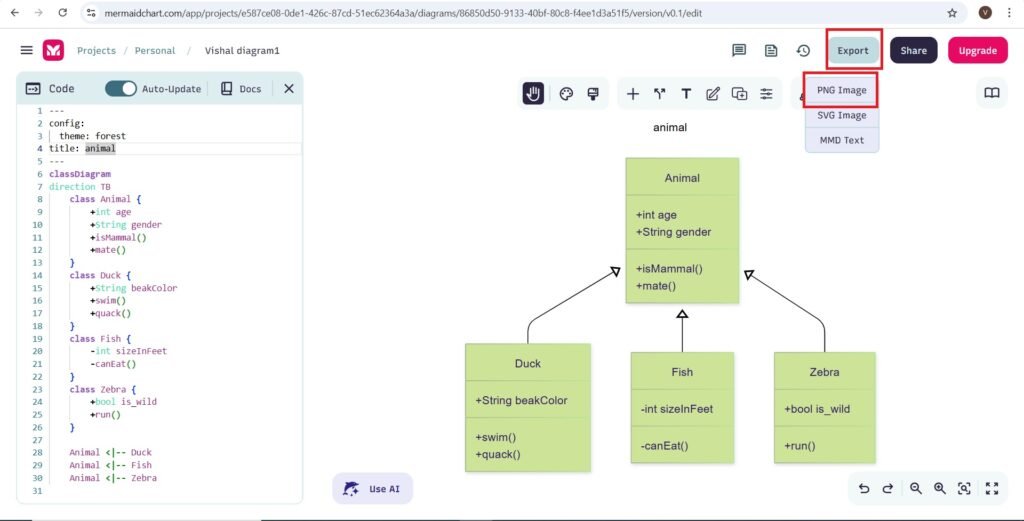
- The export of the class diagram is as follows—>
- The PNG file of the class diagram animal is as follows—>
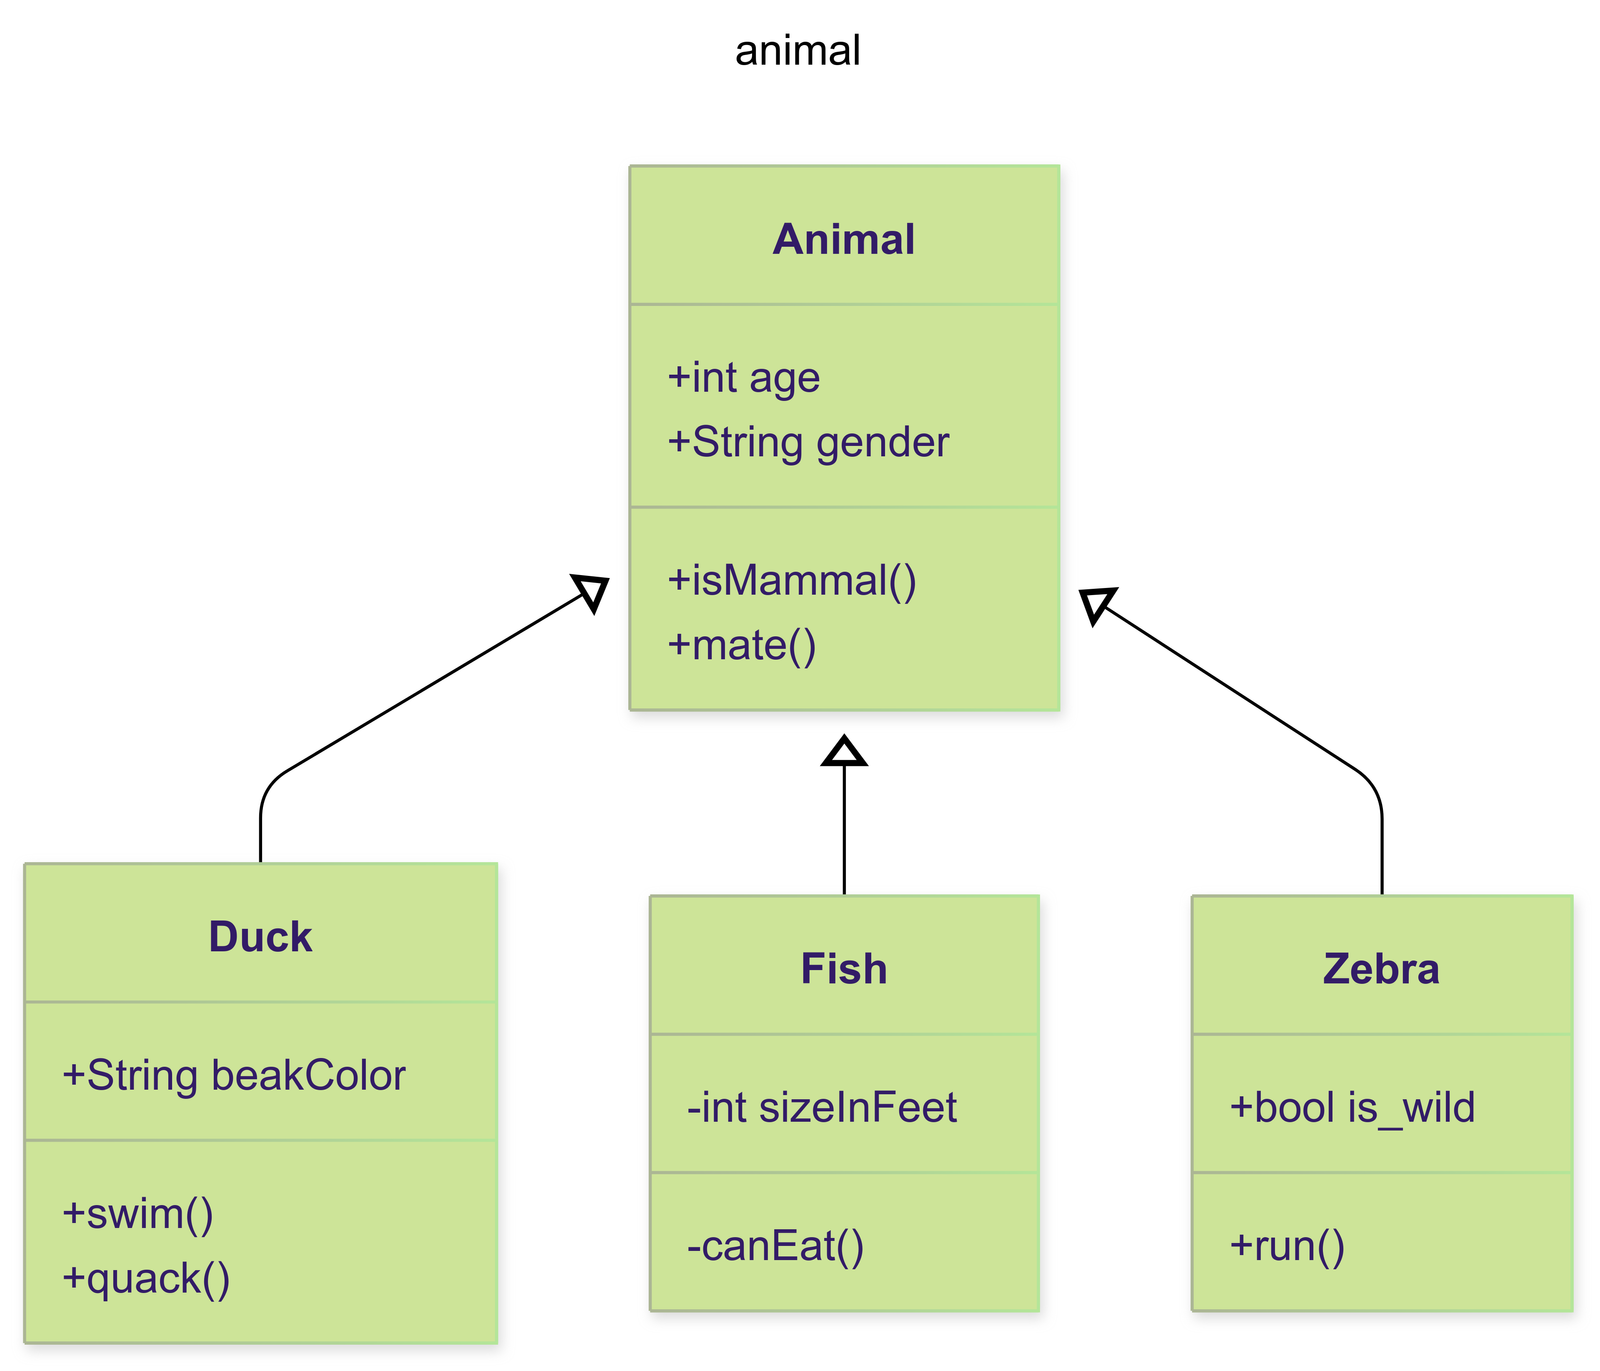
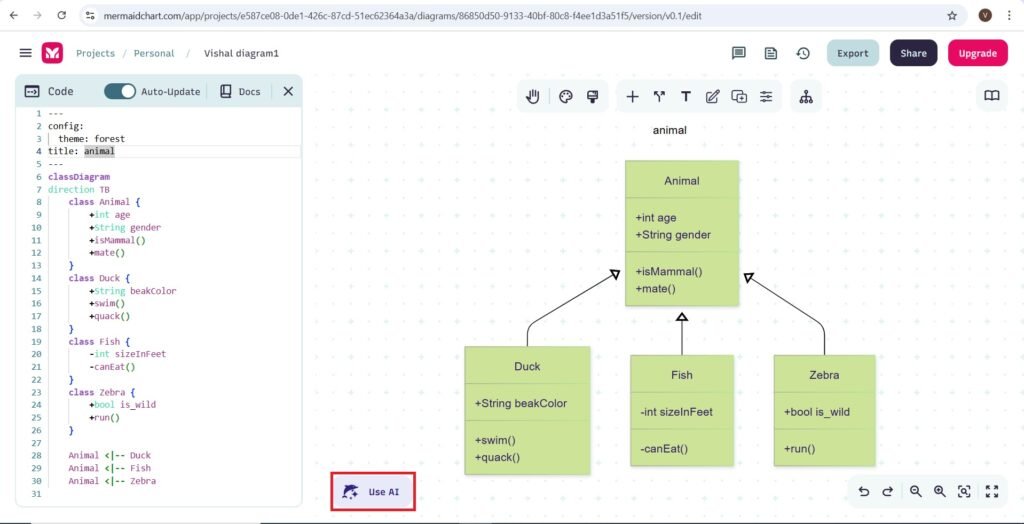
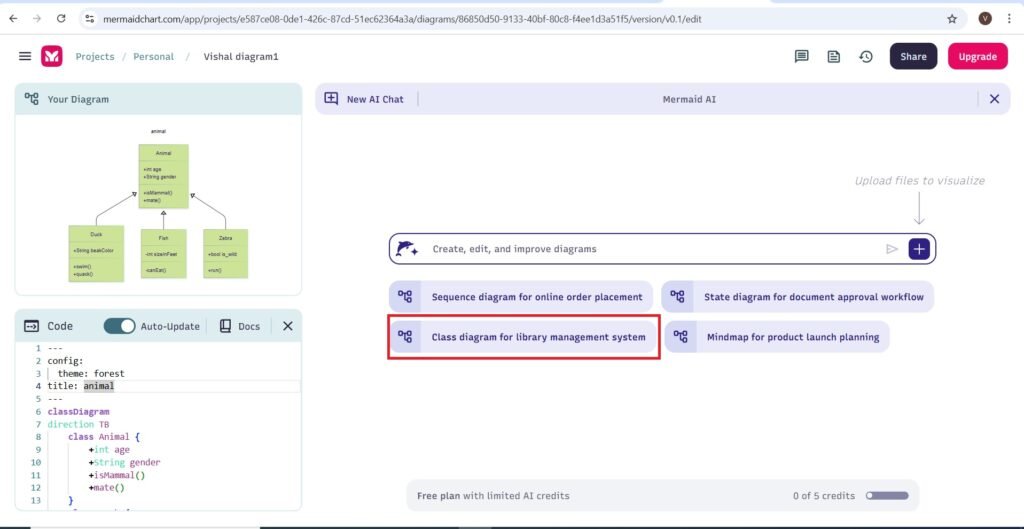
- Now we will use AI to create Diagrams and Charts—>
- Press—>Use AI
- You will navigate to the following page—>
- I am giving the prompt—>Class diagram for library management system.
- Class diagram for library management system—>
- The class diagram is created and is shown as follows—>
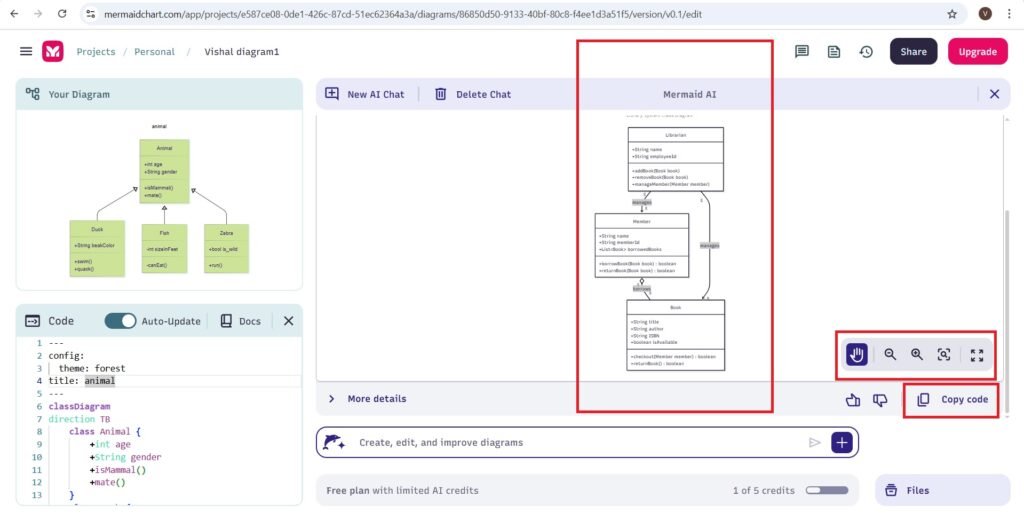
- The class diagram has the following features—>
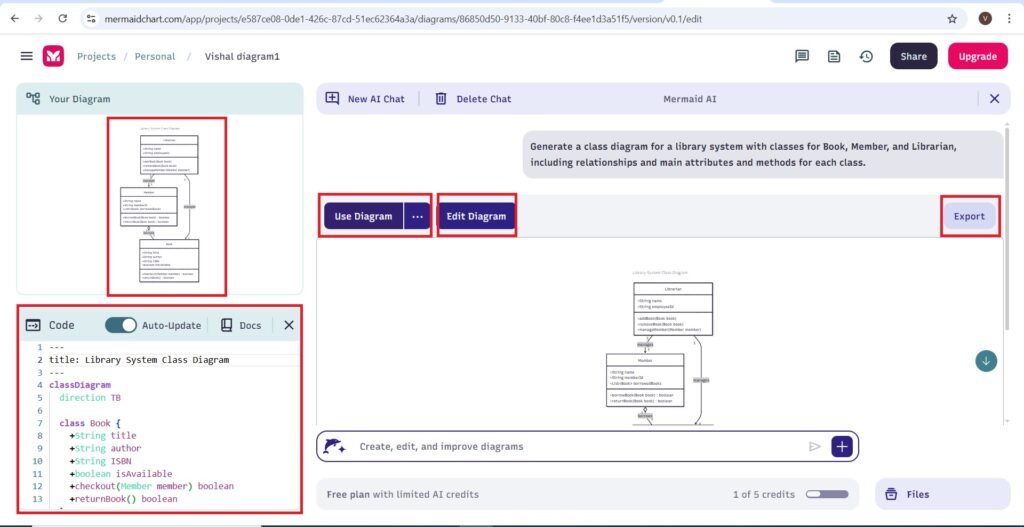
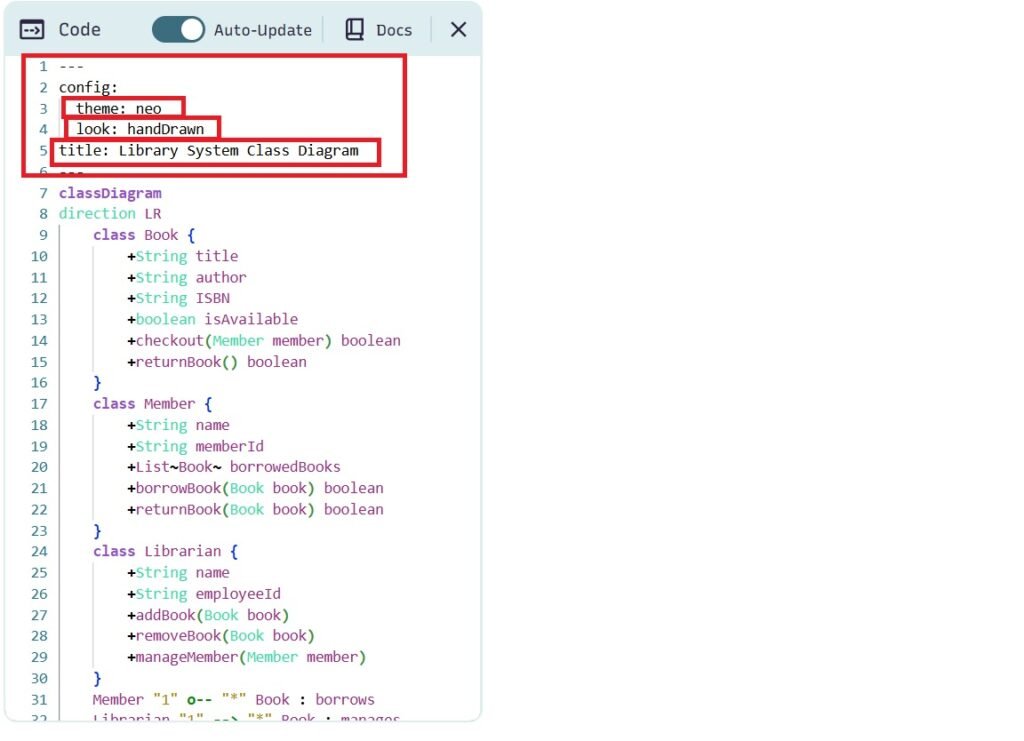
- The code is copied as follows—>
- title: Library System Class Diagram
classDiagram
direction TB
class Book {
+String title
+String author
+String ISBN
+boolean isAvailable
+checkout(Member member) boolean
+returnBook() boolean
}
class Member {
+String name
+String memberId
+List~Book~ borrowedBooks
+borrowBook(Book book) boolean
+returnBook(Book book) boolean
}
class Librarian {
+String name
+String employeeId
+addBook(Book book)
+removeBook(Book book)
+manageMember(Member member)
}
Member “1” o– “” Book : borrows Librarian “1” –> “” Book : manages
Librarian “1” –> “*” Member : manages
- When you edit the diagram—>
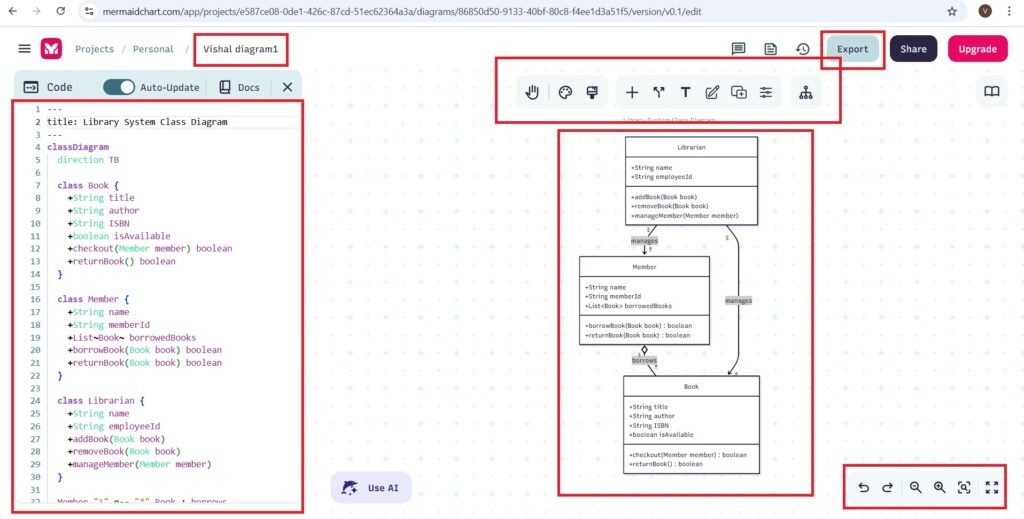
- After editing the code, the class diagram’s code is transformed as follows:-
- The code of the class diagram is as follows:-
- The export of the class diagram of the Library Management System is as follows:-
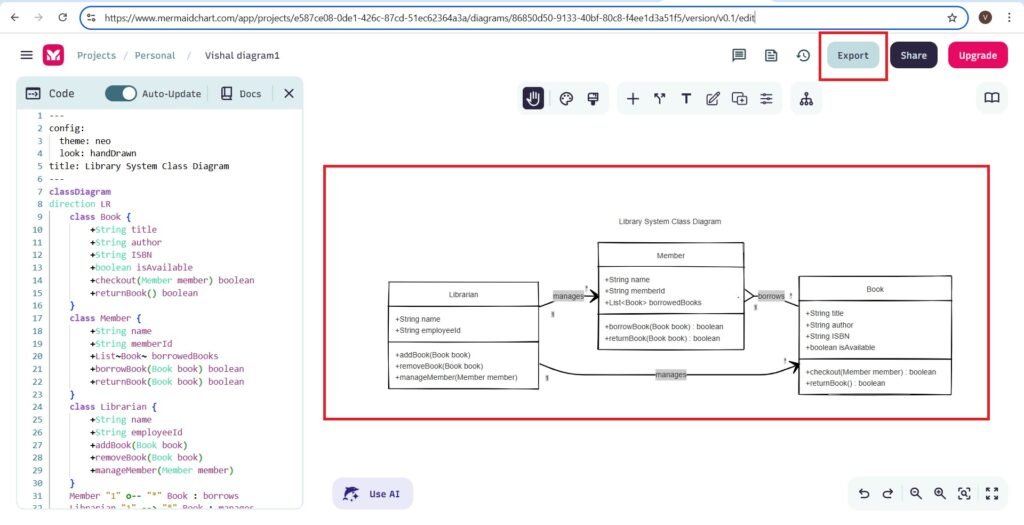
- The export of the Library Management System is as follows:-
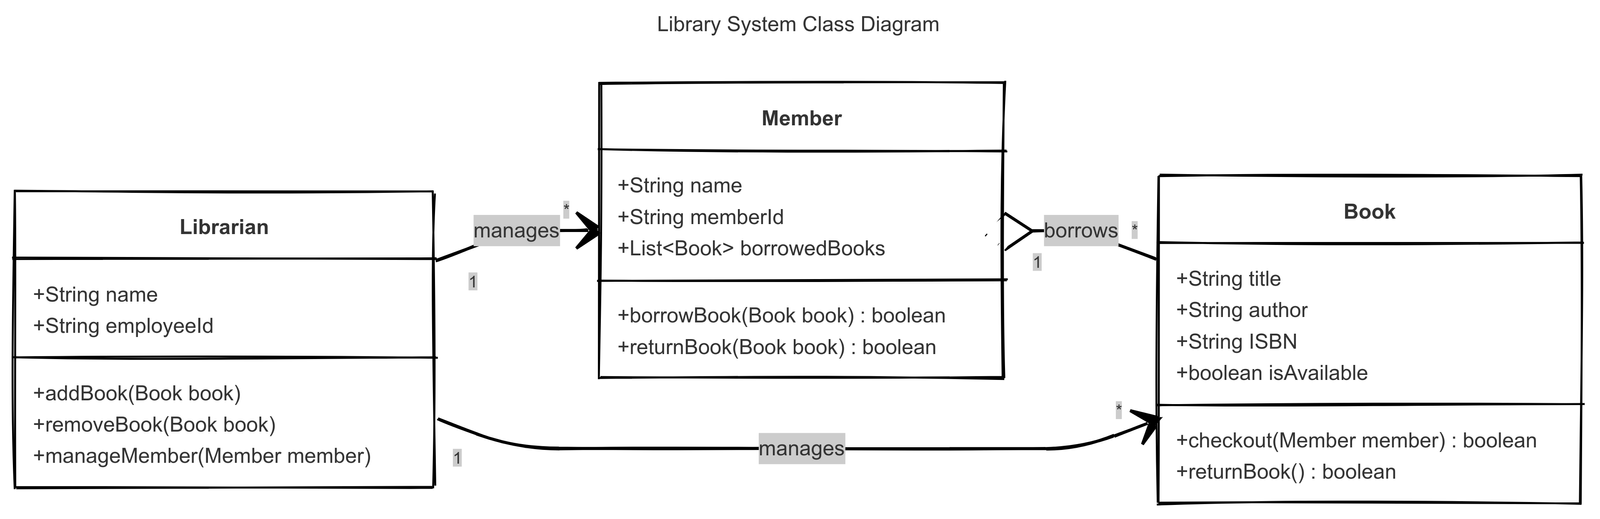
Infographics Reimagined: Inside the Mind of Infogram AI
Frequently Asked Questions(FAQs)
Who can benefit from using Mermaid Chart AI?
Developers, data analysts, product managers, educators, and anyone who needs to visualize complex processes or systems.
Can I use Mermaid Chart AI for real-time collaboration?
While Mermaid itself is static, integrating it into collaborative platforms like Notion or GitHub enables shared editing and version control.
Is Mermaid Chart AI free to use?
The core Mermaid.js library is open-source. AI-powered enhancements may depend on the platform or service you’re using.
Are my diagrams stored or shared automatically?
That depends on the hosting platform. Always check privacy settings and export options before sharing.