
My blogpost, Visual Storytelling Made Easy with Piktochart AI, is based on the AI tool, Piktochart AI, which has the features mentioned in the following table:-
| Feature | Description |
|---|---|
| Pikto AI Studio | All-in-one platform with 6 AI-powered image tools for visual content creation. |
| AI Image Generator | Creates visuals from text prompts. |
| AI Image Modifier | Edits and enhances existing images. |
| AI Image Upscaler | Improves image resolution and quality. |
| AI Background Remover | Automatically removes backgrounds from images. |
| AI Image Restorer | Repairs damaged or low-quality images. |
| AI Text Remover | Erases unwanted text from visuals. |
| Use Cases | Ideal for marketers, educators, and non-designers needing quick visual assets. |
| Benefits | Eliminates need for multiple design tools; streamlines workflow. |
Introduction
- Piktochart AI is a AI tool that is used for, creating Visuals, Infographics, Posters, Presentations, Diagrams, Reports and much more, from readymade templates and resources.
- The templates used are eye-catching, easy to edit and understand, attractive, colorful and accessible.
- Piktochart AI has a user-friendly designs from which you have to choose to work upon.
- It reduces the creation of powerpoint presentations, creation of visuals from other sources like web-applications. You will get the result in minutes without too much effort, saving resources.
- Also the pricing plans are affordable for professionals without too much of a hustle.
- Professionals often spend hours in front of the computer screens to create presentations, and complex Infographics.
- The infographics are need in todays world with, data increasing on the web day after day, to make the data available and understandable to all kind of audiences.
- Visual Infographics can be made available to the whole team individually without too many efforts as it is easily accessible and shareable.
The need for using Piktochart AI for Infographic Generation
- The AI generated visuals and Infographics are used to simplify complex data, boost engagement and accelerate content creation across industries.
- In marketing and Piktochart AI can be used for accelerating campaign production as AI tools can generate visuals 2-5x faster than manual design.
- Hence the promotion of any product will become easier and become available to audiences digitally.
- Also the conversion rates of Visual-led campaigns using AI Infographics have shown upto significantly higher ones.
- The AI visual Infographic is attractive, to the point easily understandable and easily created. Hence it has the power to attract audiences through posters and banners.
- Infographics help convey brand messages clearly and memorably.
- Any promotional idea or message in banners or posters, are attractive and available to all kind of audiences. AI turns raw data into Charts, Timelines, and Comparison Visuals for meetings or investor decks.
- These charts and timelines help the working professionals understand and grasp too the point data.
- The training process of professionals becomes easier and exhaustive with the eye-catching visuals.
- AI generated diagrams and timelines help students grasp historical events, scientific processes or technical workflows.
- Piktochart AI creates all kind of technical, scientific or historical infographics for you with comparisons and charts. Learners retain more when content is presented visually.
- Posts with Infographics get more shares and like due their visual appeal. Bloggers and Influencers use AI to generate visuals from text prompts instantly.
- AI tools transform datasets into compelling visual stories for articles and reports, infographics without waiting for design teams.
- Infographics often rank well in image search and increase time on page, comparisons and visual breakdowns help shoppers make informed decisions.
- A blogpost with Infographic topic indexes and ranks well on the search results. They convey a informative value to the blogpost for all kind of audiences.
- Piktochart is ideal for teams needing high volume content across platforms.
- Content quality is the key to attract audiences in large numbers. If it is with Infographic visuals, colorful charts and comparisons, timelines, Graphics, fonts, designs easily or one platform it reduces the effort, saves time and energy.
- I have created a AI visual timeline for you from Piktochart AI. It is easy to generate with minimum resources with a large number of online templates on the platform.
- The template designs are of high quality can be used to generate, access high quality visuals.
- Launched in August 2025, Pikto AI Studio brings together six AI-powered tools into one subscription, eliminating the need for multiple design apps.
Conclusion
- AI has a mighty target of boosting productivity in the future.
- Driven by AI, Piktochart AI has a attractive, user-friendly and also have the capability for affiliate, collaborate with teams.
- If infographics are designed, created so easily, then, you yourself can imagine the power of AI boosting productivity and creating unending deadlines.
How to use Piktochart.com?
Visual Storytelling Made Easy with Piktochart AI, i.e. the process of using Piktochart.com is as follows:-
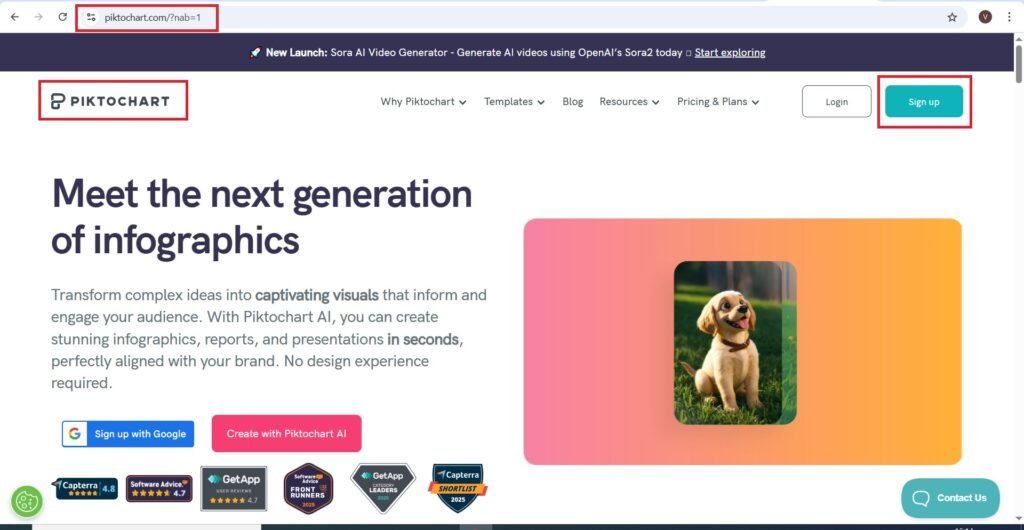
- Go to https://piktochart.com/?nab=1 .
- Press—>Sign up
- Continue with Google—>
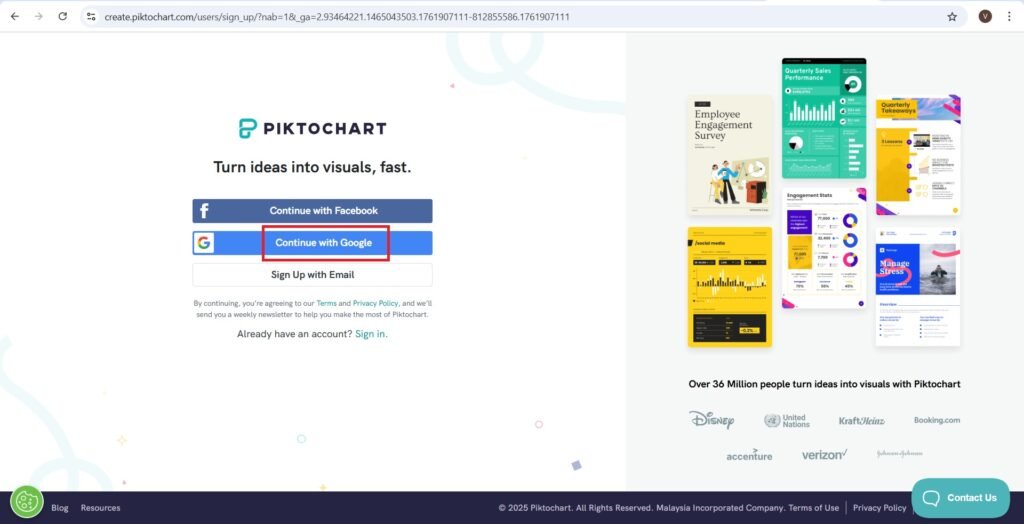
- Choose an account—>
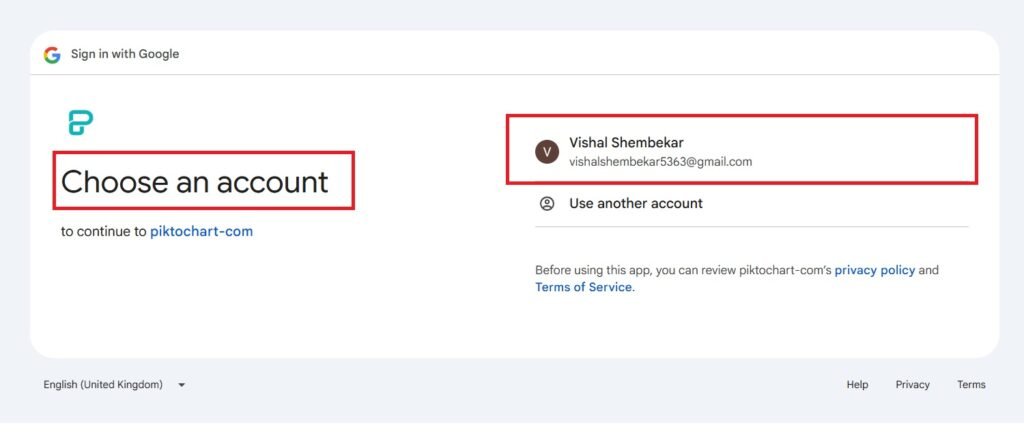
- Answer the following questions and press Continue—>
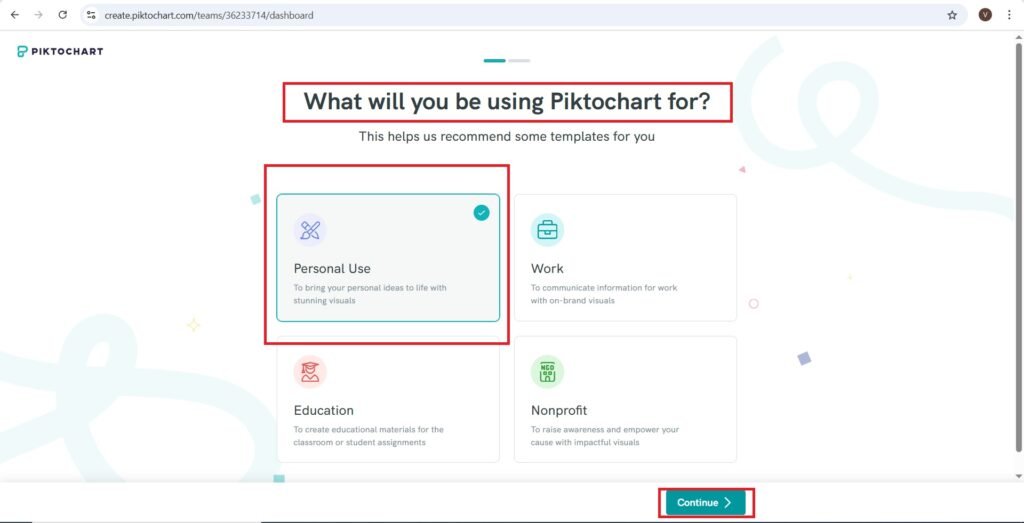
- You will navigate to the following page—>
- Press—>Infographic. or Create Infographic on the right hand side corner.
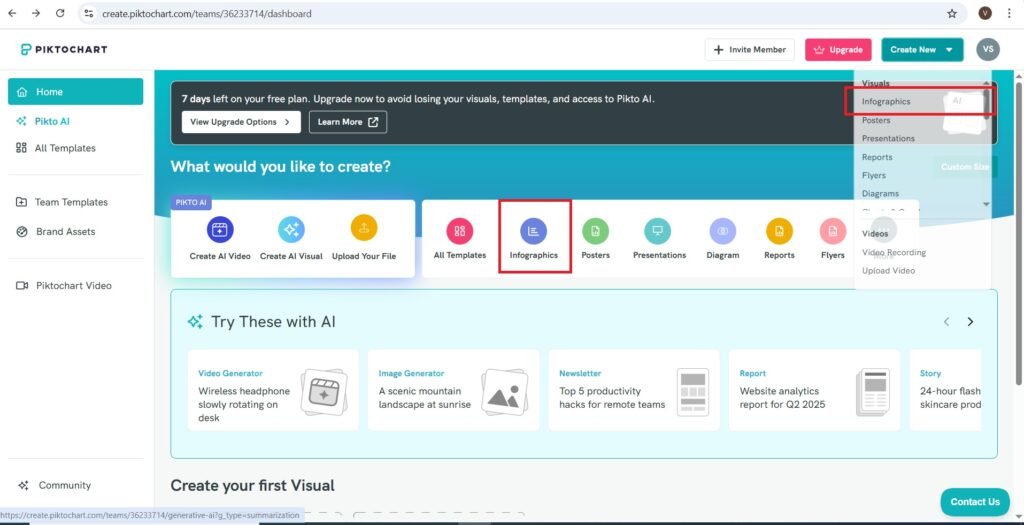
- You will get the following page—>
- Press—>Generate AI Infographic
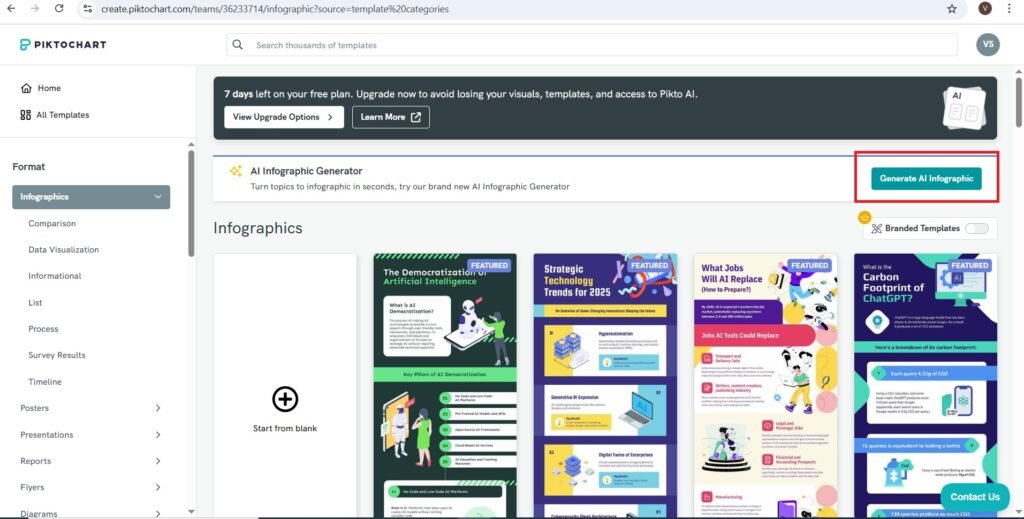
- You will navigate to the following page—>
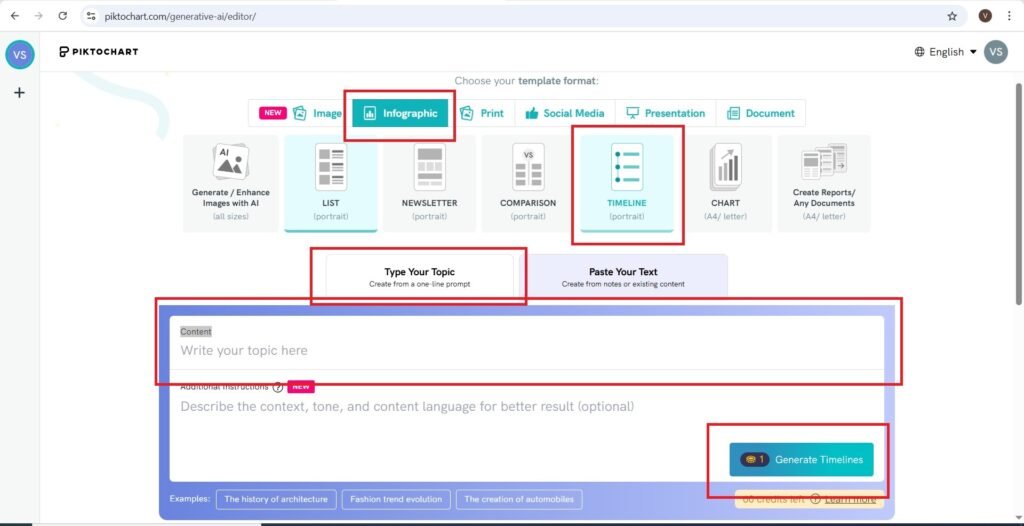
- Select—>Infographic then Timeline and then Select—>Type Your Topic
- Press—>Generate Timelines
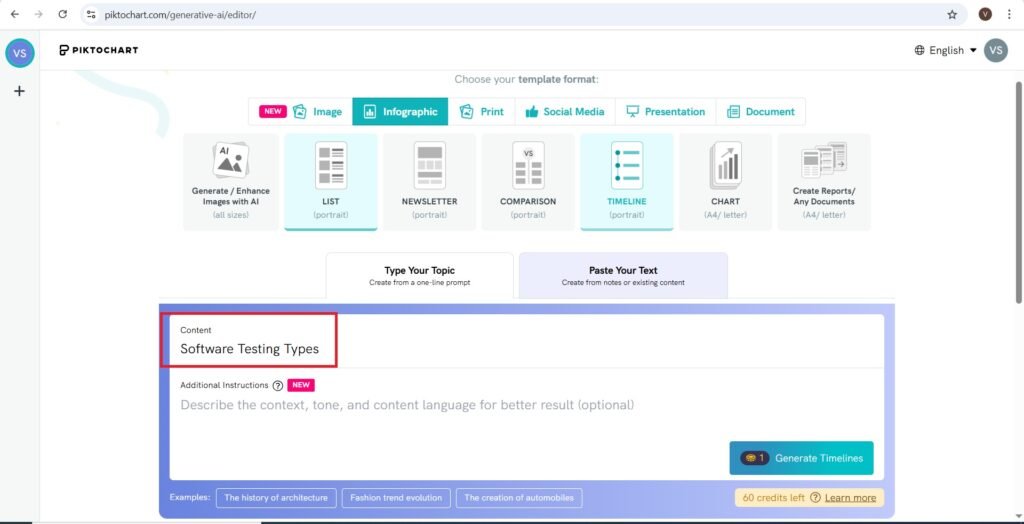
- Enter Your topic, I am entering, ‘Software Testing Types’, as shown—>
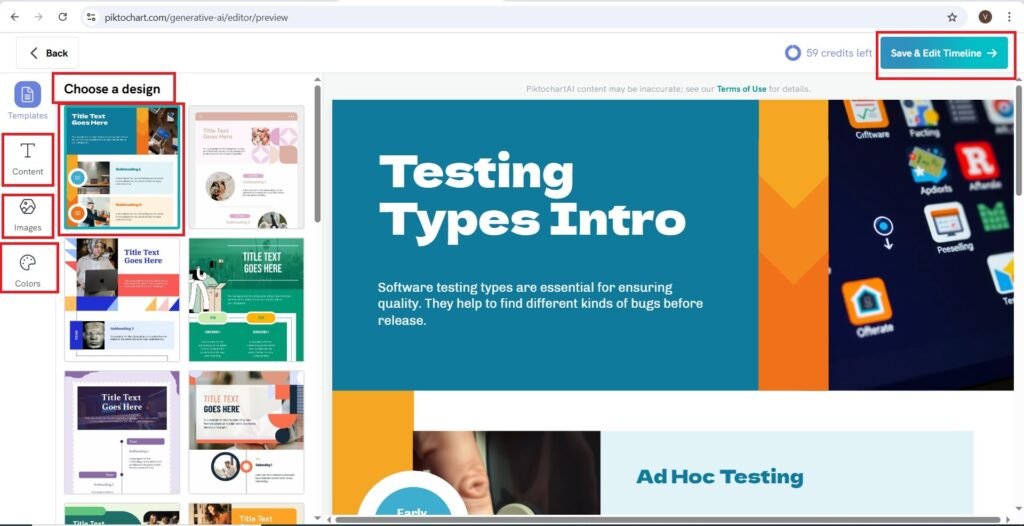
- Choose a Design—>
- You can choose a Design from the given designs on the left—>
- You can add Text, Colors and Images to the Infographic generated—>
- Press—> Save & Edit Timeline
- You will navigate to the following page—>
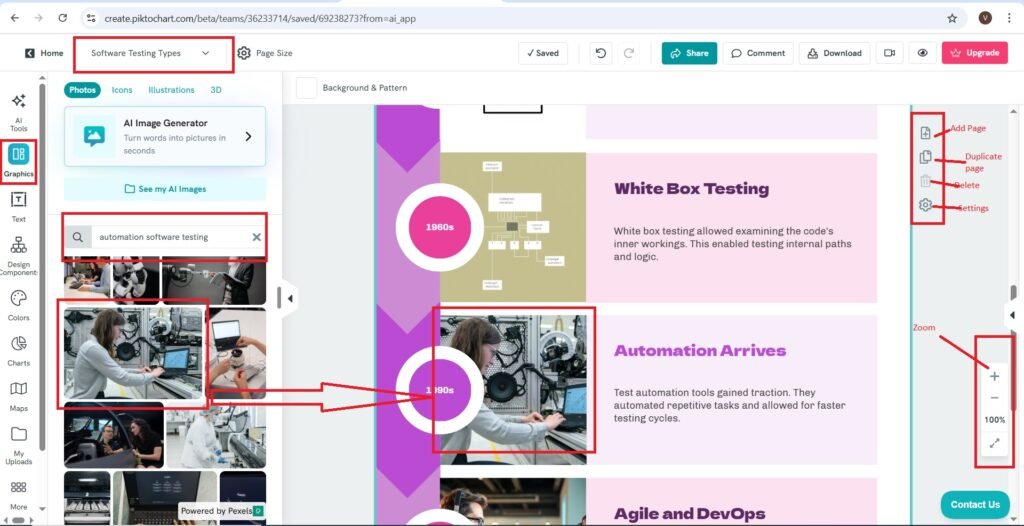
- You can add Graphics to the Infographic generated—>
- Enter the name of the topic on which you need an Image.
- The images will arrive as shown.
- Select the image that you want.
- Press on the Image in the infographic on which you need an image.
- The image from the left arrives on the infographic.
- On the right there are options to Add Image, Duplicate Page, Delete, Settings.
- There is also an option to Zoom in the Infographic—>
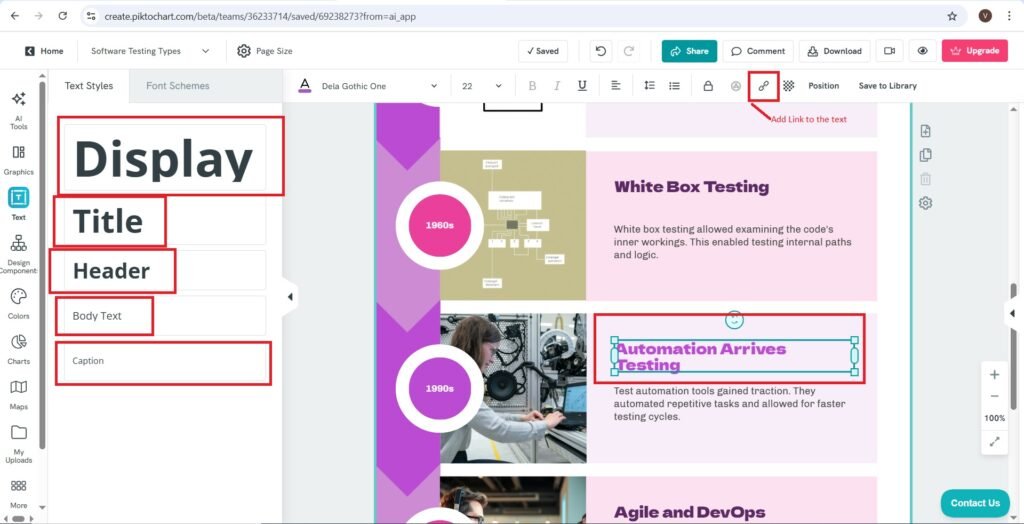
- The editing text options are as follows—>
- You can edit the text in the Infographic. There are plenty of editing options shown at the top of the infographic.
- You can add Link to the Infographic’s text.
- You can Select the Text options like display, title, header, body text, caption to add more textual content in the Infographic.
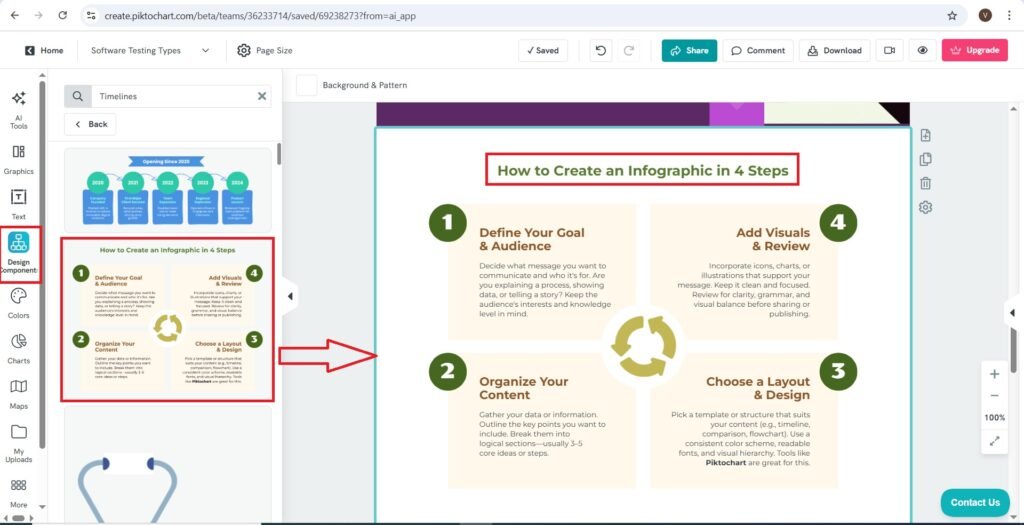
- You can even add a Design Component to the Infographic—>
- I have added a new page and added a Design Component to the Infographic as shown—>
- The Design Component is—>’How to Create an Infographic in 4 Steps’.
- You can even edit the textual content in the Design Component.
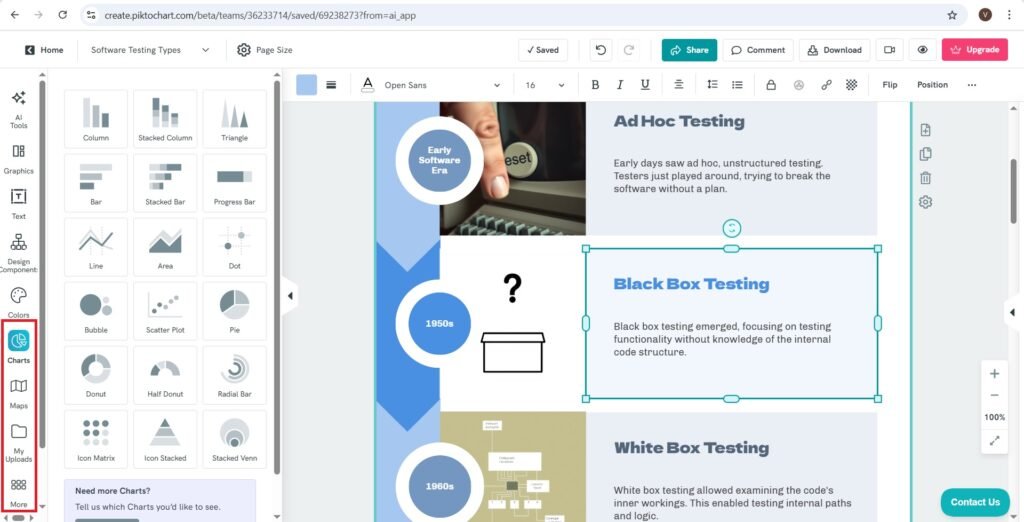
- Now we will add colors to the Infographic—>
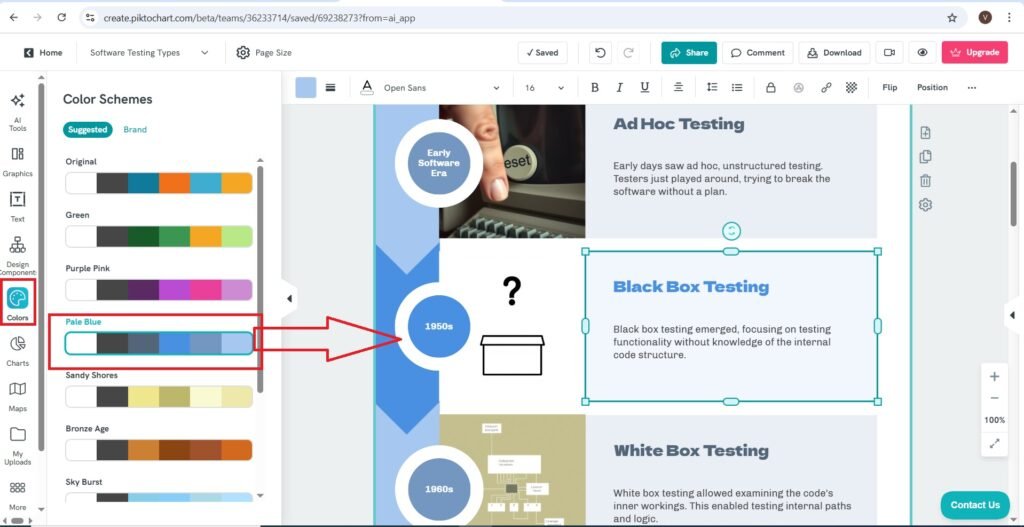
- You can even add charts, maps or upload the data that you want—>
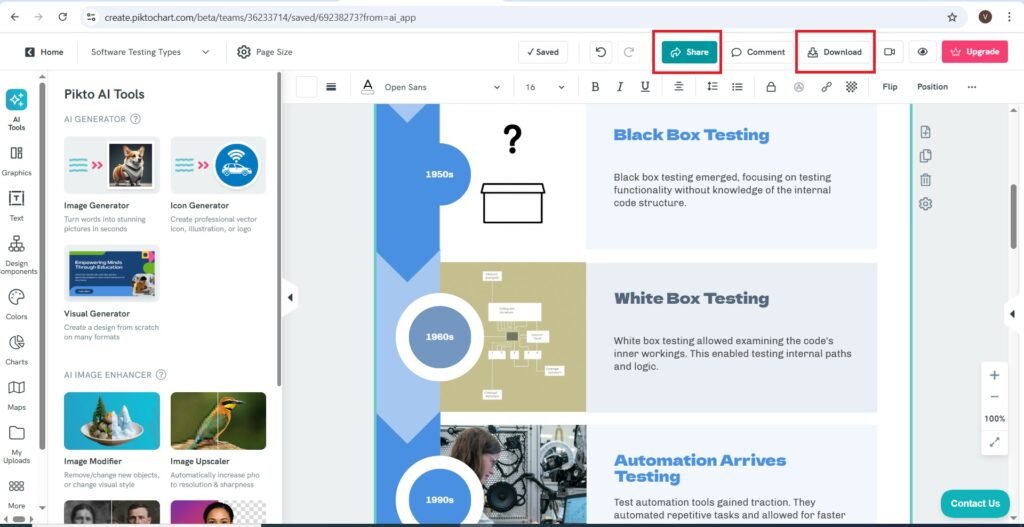
- Now I am going to access the Infographic—>
- The access to the Infographic in the form of a PNG image is as follows—>
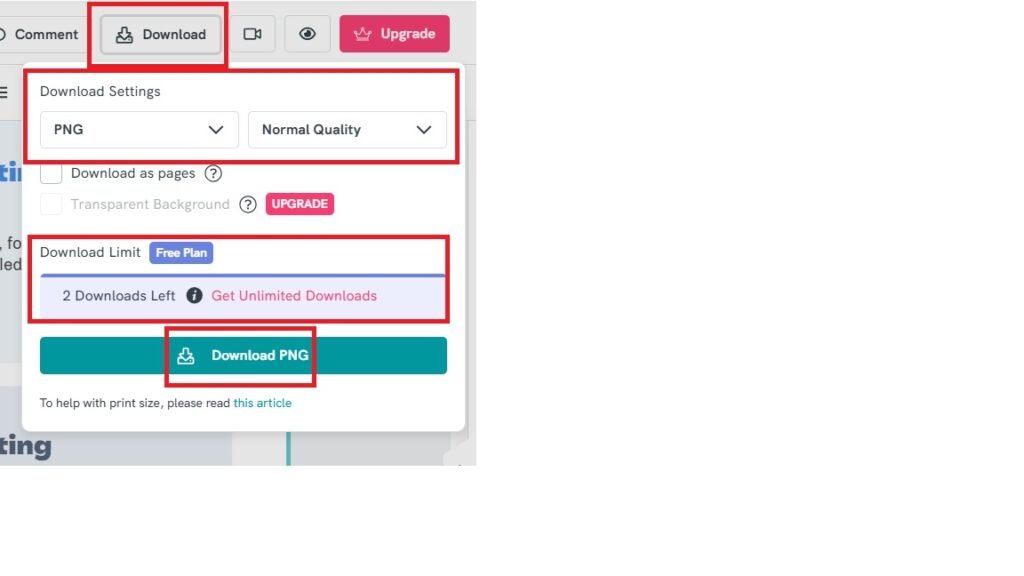
- The Infographic Generated in the form of PNG file is as follows—>
- You can get The Infographic in PDF or Powerpoint file format—>

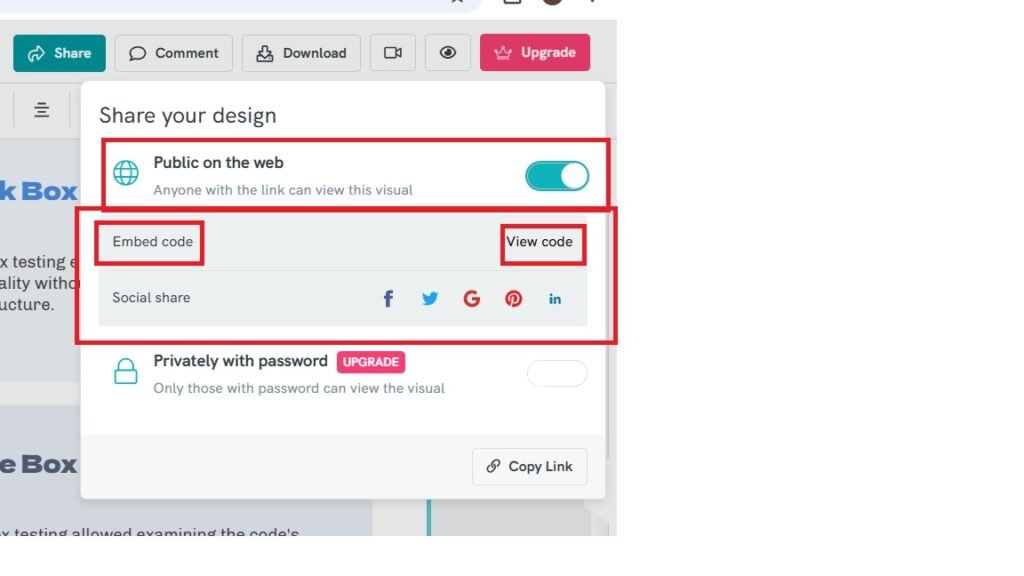
- You can share the Infographic as follows—>
- The shared file is as follows—>

- The link copied is as follows—>
- The Link is as follows—>
- https://create.piktochart.com/output/da23c77e9bc1-software-testing-types.
- There is an option to use the Infographic on the web. For that you have to turn on the option, and copy paste the HTML code on the website you want.
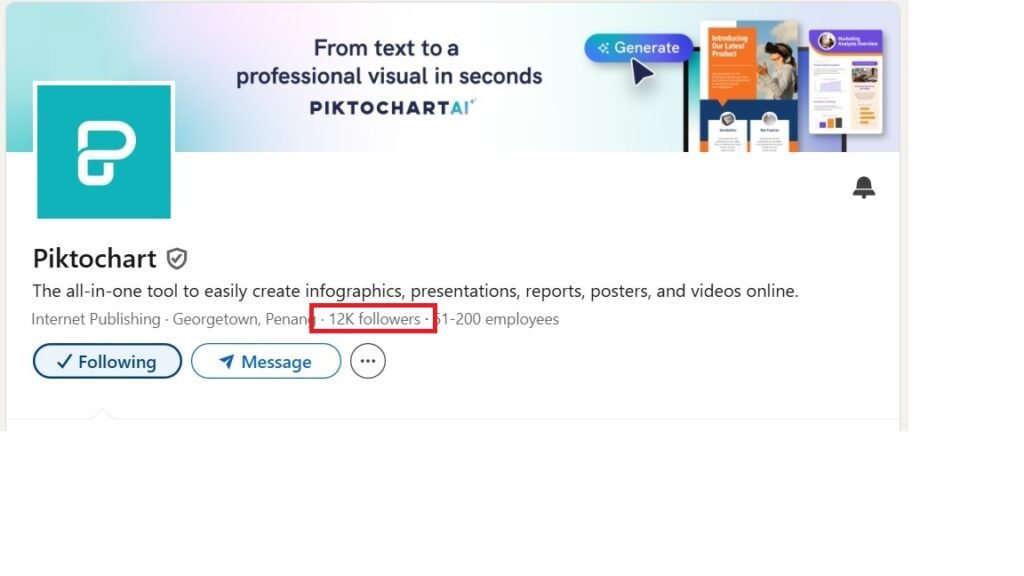
Official Page of Piktochart AI on LinkedIn
The number of followers of Piktochart AI on LinkedIn is 12K.
Charting the Deep with Mermaid Chart AI
Frequently Asked Questions(FAQs)
Can Piktochart AI integrate with other platforms like Canva or Google Slides?
Currently, Piktochart AI does not offer direct integrations with Canva or Google Slides. However, users can export visuals in common formats (e.g., PNG, PDF) and manually import them into other platforms.
Is Piktochart AI suitable for creating infographics in multiple languages?
Yes, Piktochart AI supports multilingual text input, allowing users to create infographics in various languages. However, users should verify font compatibility and layout adjustments for non-Latin scripts.
Does Piktochart AI offer team collaboration features?
Piktochart AI includes team workspaces where users can share projects, comment, and co-edit visuals. This is especially useful for marketing teams, educators, and remote collaborators.
Are there accessibility features in Piktochart AI for visually impaired users?
While Piktochart AI focuses on visual design, it does allow for alt-text descriptions and readable fonts. However, full accessibility support (like screen reader optimization) is still evolving.
Can Piktochart AI be used for data visualization from spreadsheets or databases?
Yes, users can upload CSV files or manually input data to generate charts and graphs. Advanced database integrations are limited, but it’s ideal for quick visual summaries of spreadsheet data.