
- My blogpost, Infographics Reimagined: Inside the Mind of Infogram AI, is detailed narration of the following table:-
| Feature/Aspect | Details |
|---|---|
| Purpose | AI-powered infographic generation (charts, slides, maps, posters, etc.) |
| Target Users | Professionals, businesses, creators, tutors |
| Ease of Use | Simple login, intuitive interface, quick infographic creation |
| Templates | Ready-made templates for charts, maps, dashboards, social media posts |
| Data Input | Supports Google Sheets, SQL databases, JSON feeds, Dropbox, etc. |
| Editing Options | Visual editing of charts, maps, text, graphics; supports file imports |
| Export Formats | PDF, PNG, PowerPoint |
| Pricing | Affordable plans with enhanced features |
| Benefits | Saves time, improves data visualization, enhances communication |
| Applications | Teaching, marketing, research, presentations, social media sharing |
| AI Capabilities | Trained on diverse infographic types; adapts to user needs |
| Future Potential | High-quality output, evolving features, strong impact on professional work |
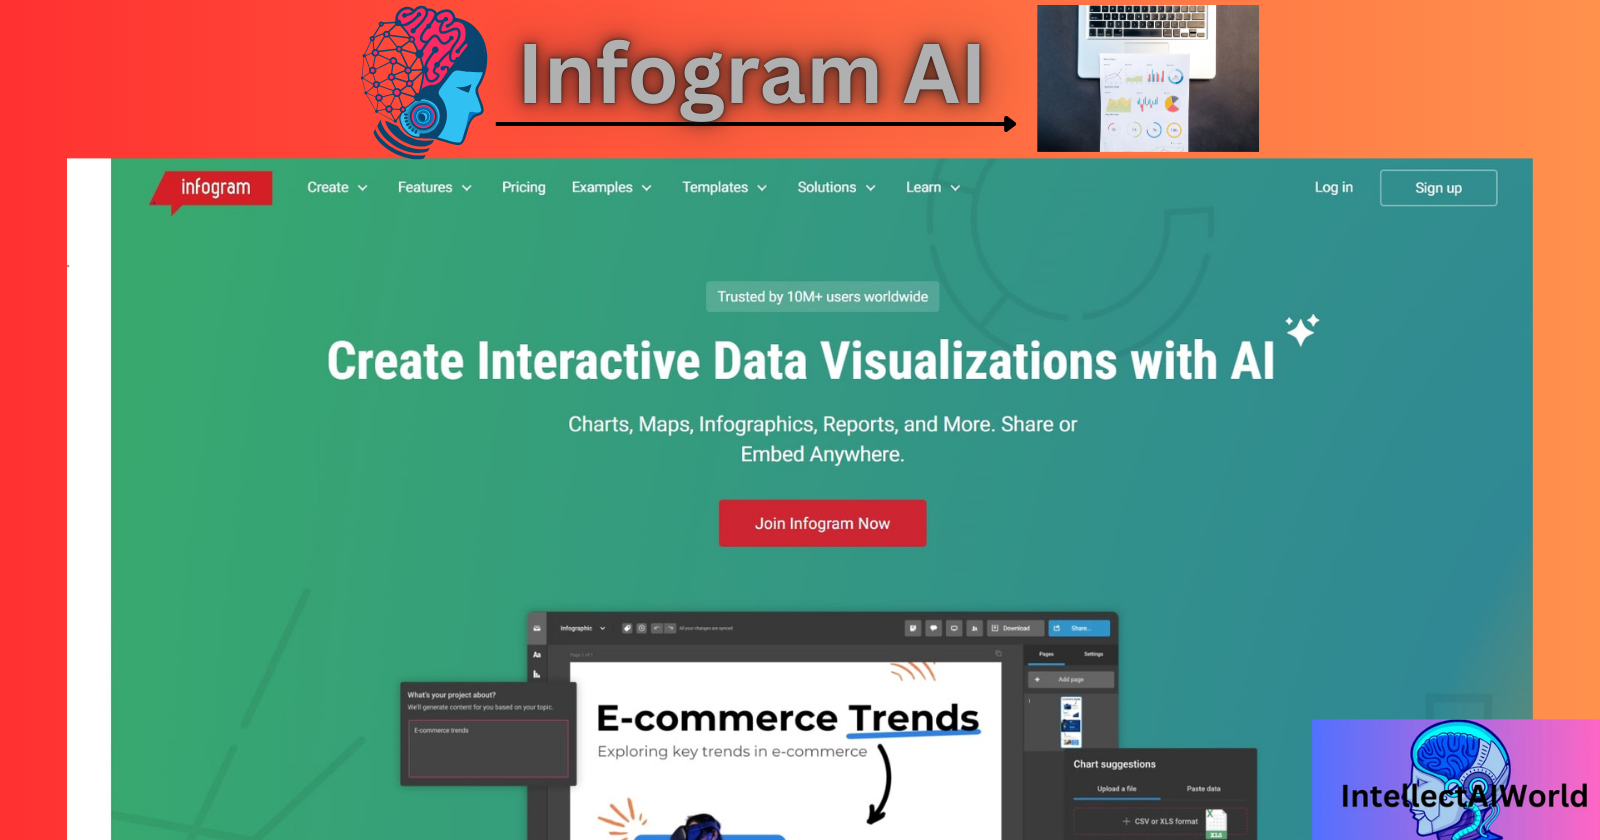
Introduction
- Infogram AI is used for generating infographics like Charts, Slides, Maps, Posters, etc.
- The AI tool is user friendly with a simple login process.
- The audiences like working professionals, businesses, creators, tutors, etc are attracted towards the AI tool, as infographics are generated in minutes, without too much effort.
- The pricing plans are available at affordable costs for all kind of audiences.
- The paid plans offer a variety of features for generating infographics.
The need for using Infographic AI
- There is no need to spend time on Infographics creation software, spending hours in front of the computer screen, creating and editing infographics and analyzing the data.
- The usage process id genuinely simple and data can be easily analyzed and depicted in the form of Infographics.
- The templates are readily available on the platform and can be shown with great insights and analysis.
- The percentage of allocation to each unit or party can be easily distinguished from the Infographics created.
- In simple words, a single person can carry out the analysis on the AI tool, an infographics will depict your analyzed data.
- You can even enter data in the form of a table on Google Sheets format on the AI tool. It is shown in the process given below.
- Every infographic has its own importance and can be easily generated by the AI tool, as per the individuals need.
Export to PDF, PPT, DOC
- You can even develop your own Infographic with AI. You can Import PDF, PowerPoint(PPT) and Word(DOC) into Infogram to edit them visually.
- After designing your Infographic, you can export it to PDF, or PNG and in some cases to PowerPoint(PPT) for presentations.
- If you want to edit the data, it can be easily done. Just edit the data on the Google Sheet Format, or upload a new data file, the data will be automatically modified on the Infographic created.
- The AI tool is trained on a variety of Infographics. Artificial Intelligence has a great future in the form of this tool.
- I have given a link in my blog, below, about the Infographic Shared by me from this AI tool. There is a feature of editing the Name of your project and the text present on the infographic.
Why are Infographics Important?
- The data in the form of Infographics can be easily understood. The processing of information in the form of visuals is easily grasped and understood.
- The visuals in the form of Charts, Graphs and Maps etc. can easily grab attention of all kind of audiences. It is better to view a Chart or a Graph Than just reading unorganized textual data.
- Teaching concepts, generating an idea or sharing research, infographics, make your message more persuasive and memorable.
- Infographics are highly shareble on Social Media, blogs and presentations, making them a powerful tool for outreach and virality.
- Digital Marketing Experts, Working Professionals, Marketers, Tutors have a great understanding of the data depicted in the form of Infographics.
- Our mind processes Information better with Infographics and the AI tool will do it for you.
- You can even update your data in the form of Infographics with time as the projects can be easily saved on the platform.
- The raw data can be converted to Infographic data by using Infogram AI and hence have a real impact on your daily work.
- Businesses can visualize, analyze, summarize data with the AI tool and hence create a great impression, to collaborate with other businesses.
Conclusion
- Infographic AI is a AI Infographic Generator, that possess immense potential, as compared to other similar AI tools.
- With AI conquering the unlimited possibilities, to learn the use of Infogram AI has become a necessity for any kind of a professional.
- Web applications that were used for generating infographics, which took hours for developing them, are now just age old applications, with professionals shifting to this AI Infographic Generator.
- Great results are expected from this AI tool in the coming years, to unlock its full potential.
- Also the quality of the Charts, Slides, Maps, Posters produced is accurate, of high quality and well organized.
How to Use, Infogram AI?
Infographics Reimagined: Inside the Mind of Infogram AI i.e. the process of using Infogram AI is as follows:-
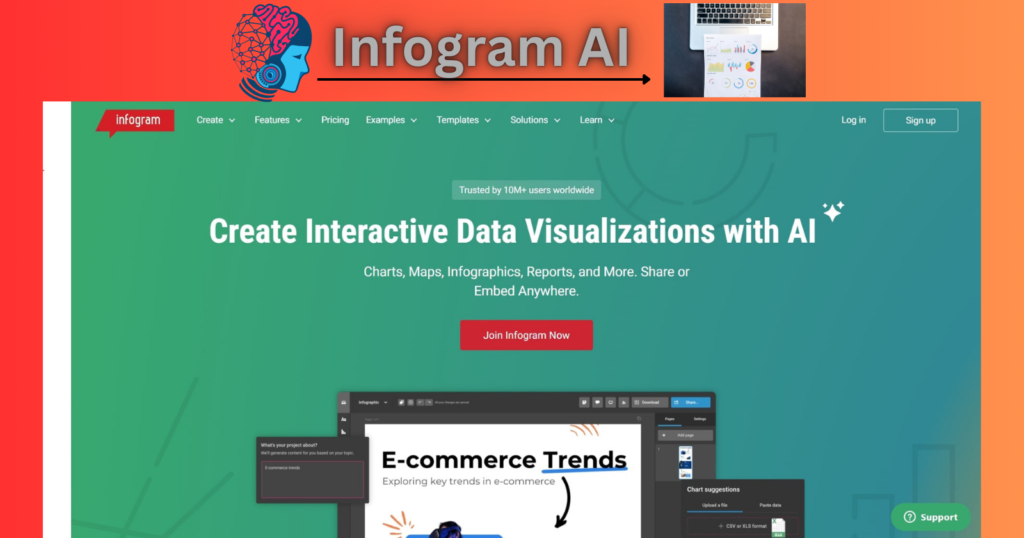
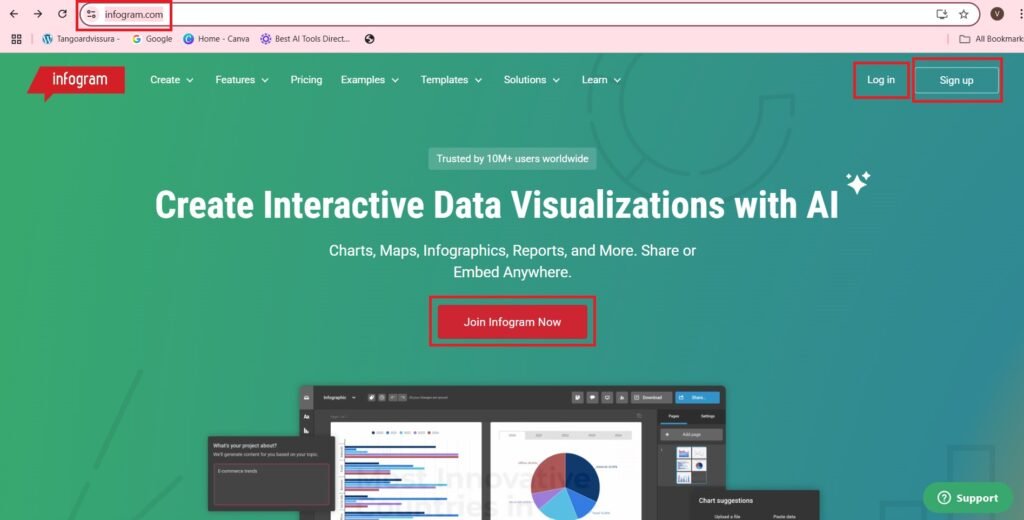
- Go to https://infogram.com/ .
- You will navigate to the following page—>
- Press—>Sign up
- Sign Up with Google—>
- Or you can sign up with Facebook, or your work email—>
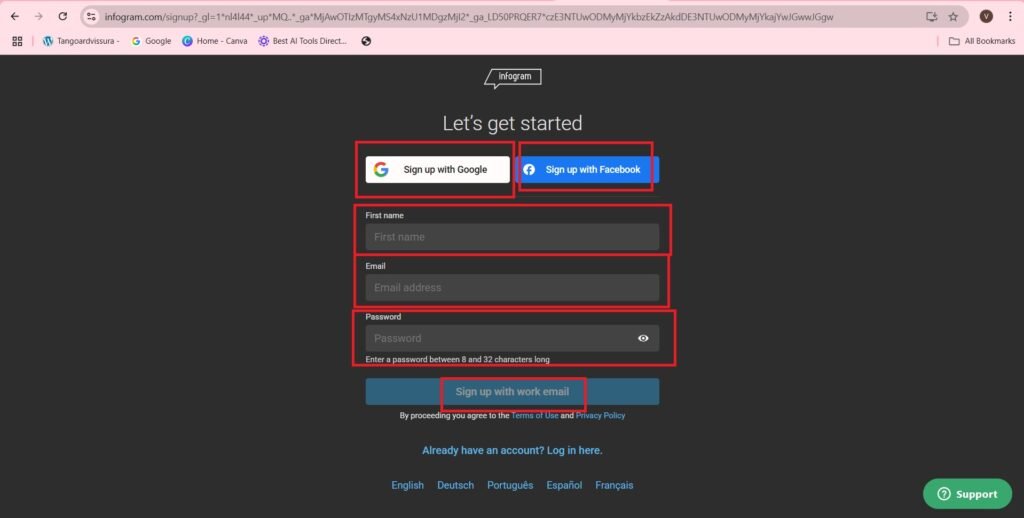
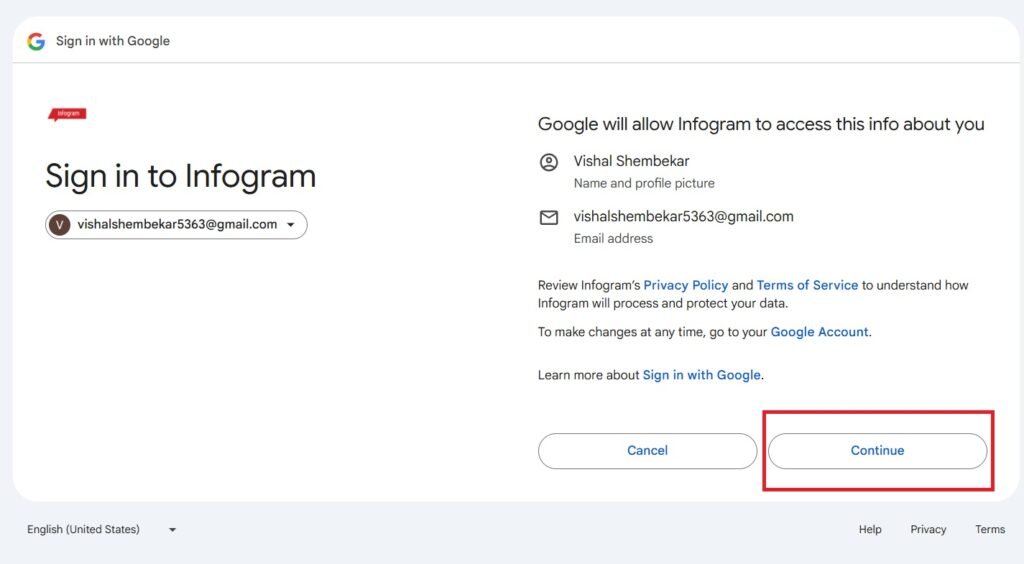
- Choose an account—>
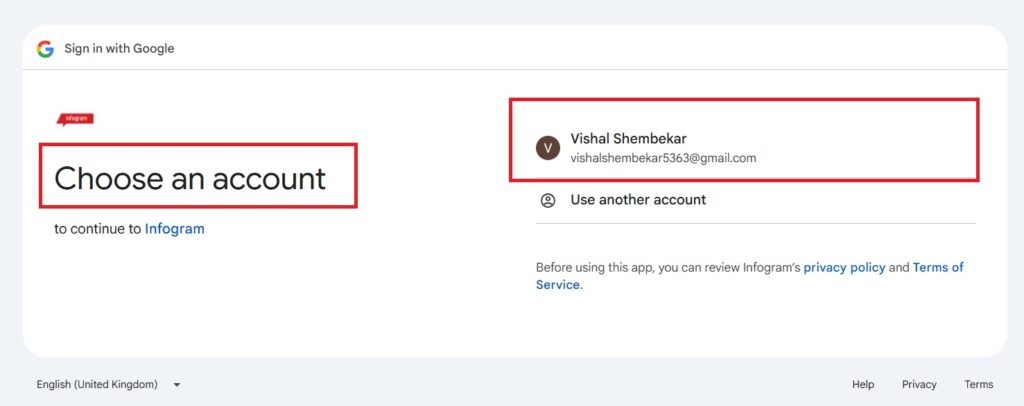
- Continue—>
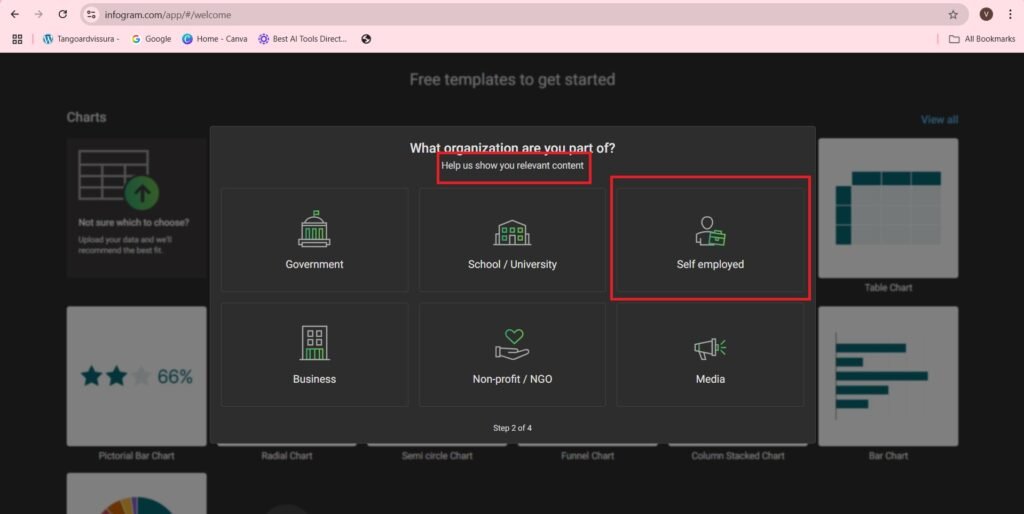
- What organization are you part of?—>
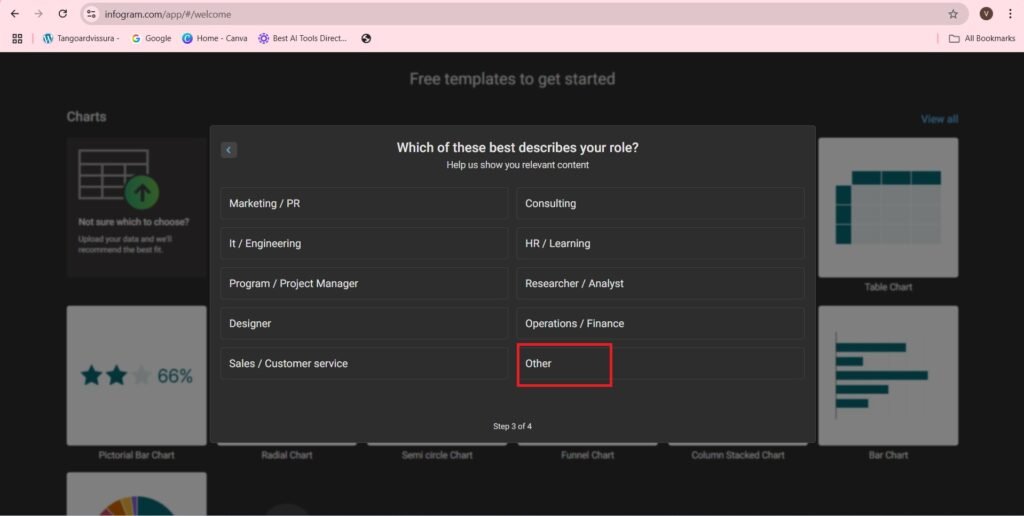
- Which of these describes your role?
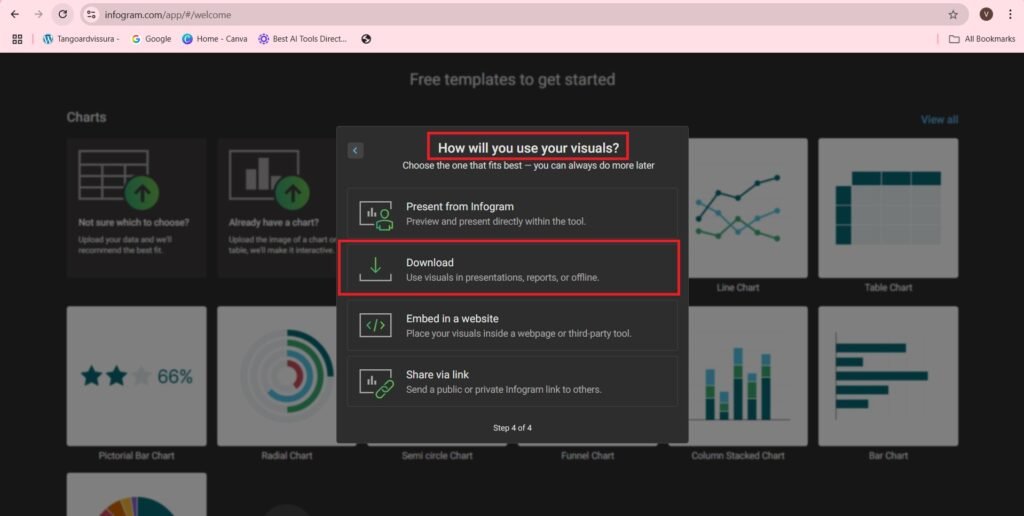
- How will you use your visuals?
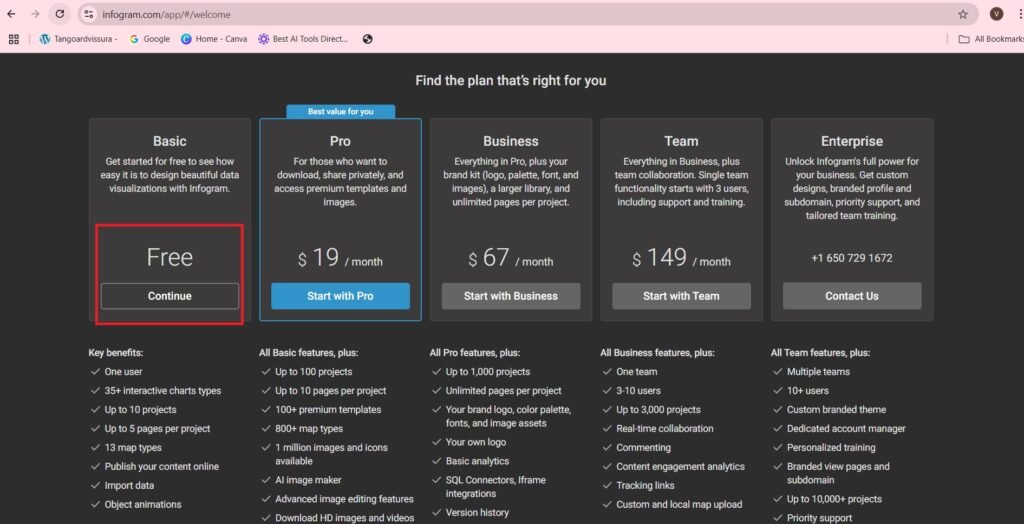
- You can use the free plan—>
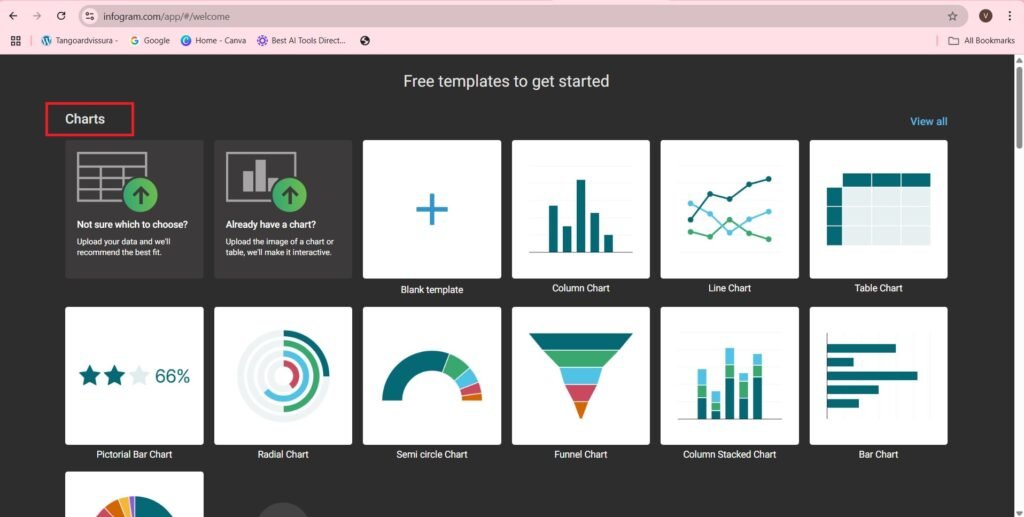
- Free templates to get started—>
- You can view all the templates
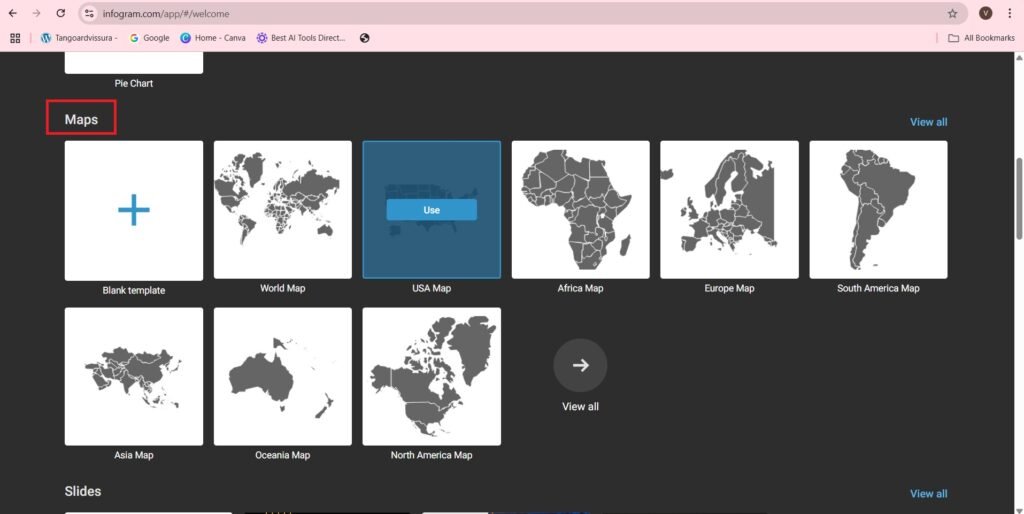
- These include—>
- Charts—>
- Maps—>
- Slides—>
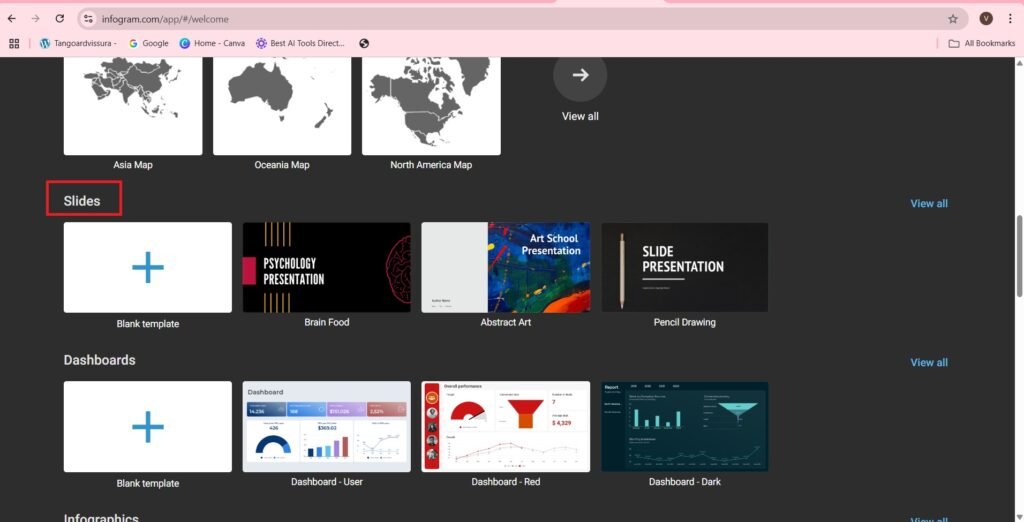
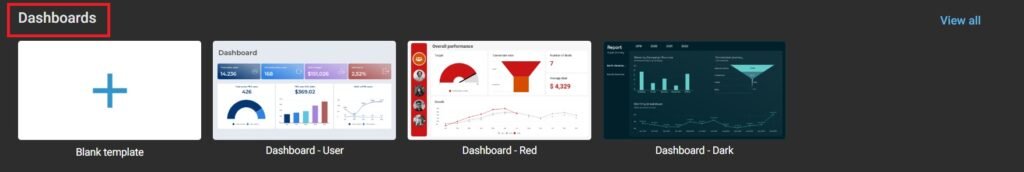
- Dashboards—>
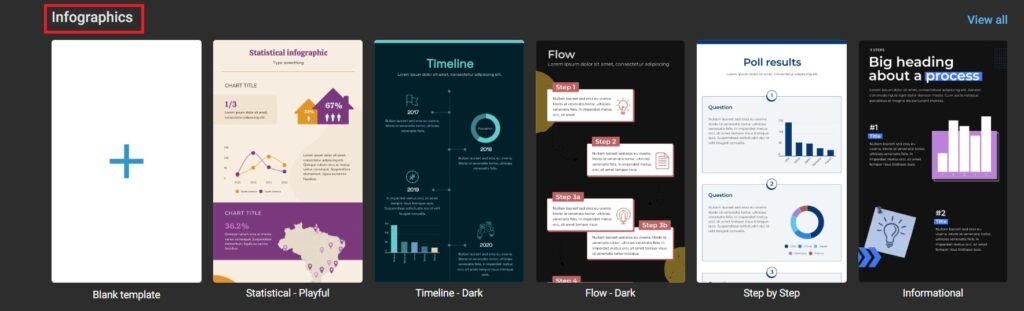
- Infographics—>
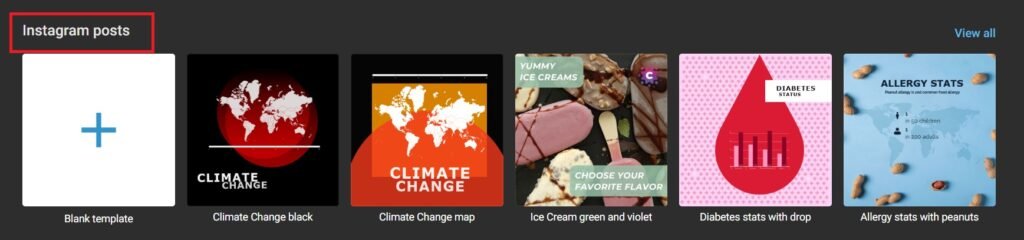
- Instagram Posts—>
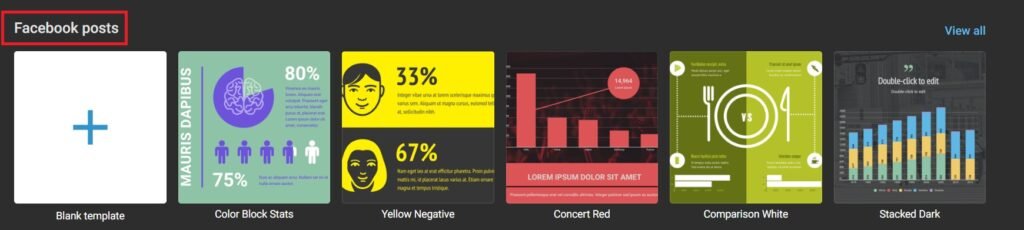
- Facebook posts—>
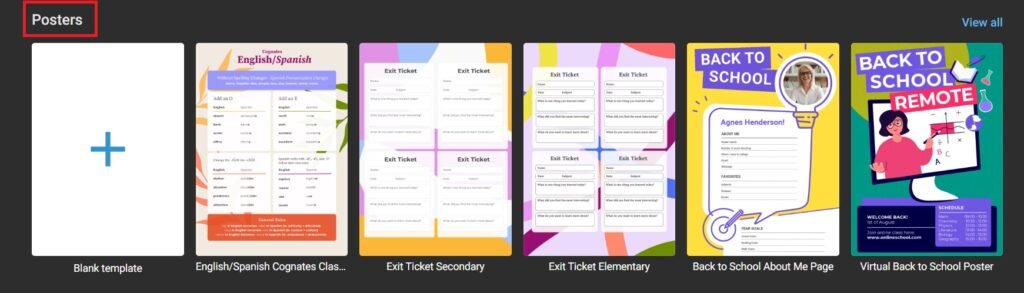
- Posters—>
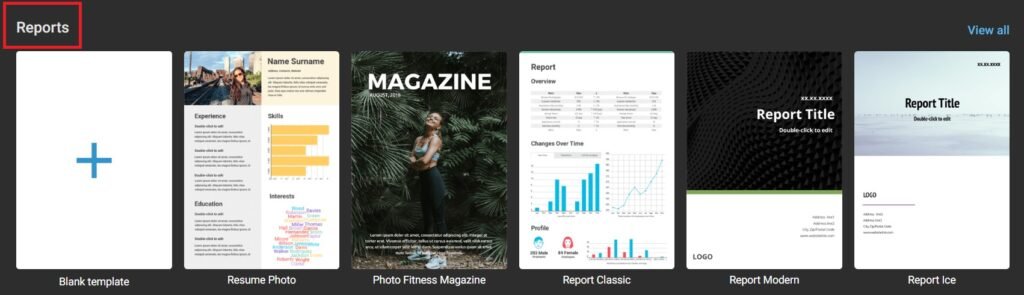
- Reports—>
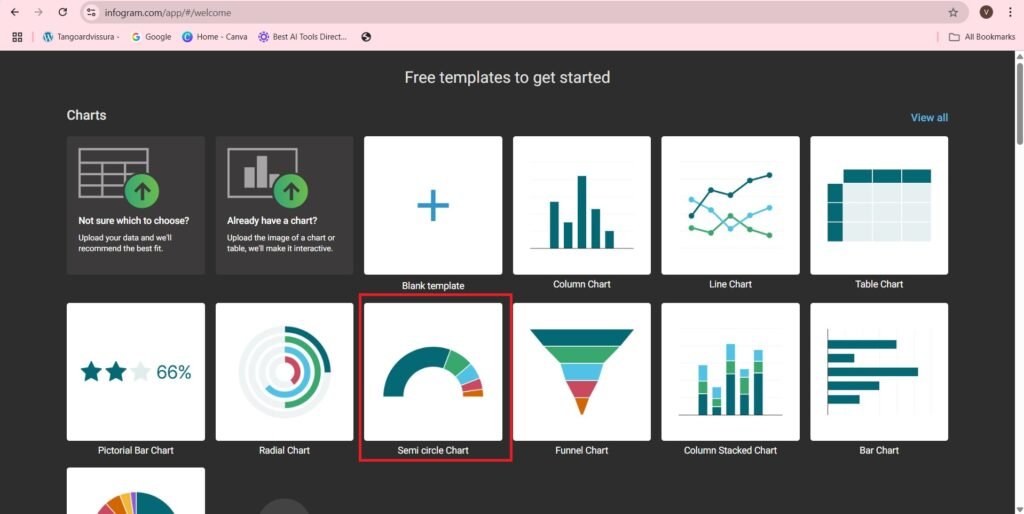
- Now we will learn, how to create a Chart—>
- Scroll to the Charts section,
- Select the required type of chart you want—>
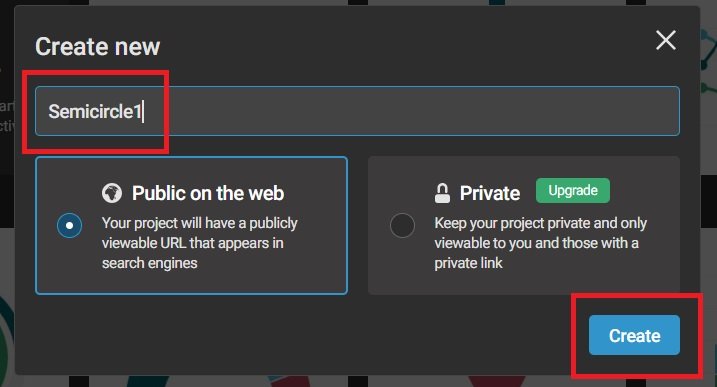
- I am selecting the Semi Circle Chart—>
- Press—>Semicircle chart,
- Enter the name of the chart—>
- Press—>Create
- The project is created on the account as shown—>
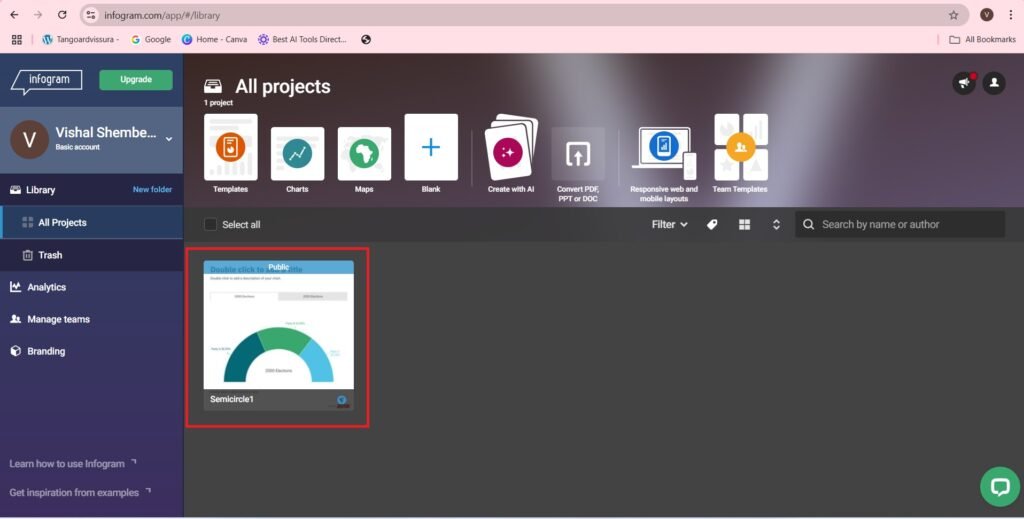
- You will navigate to the following page—>
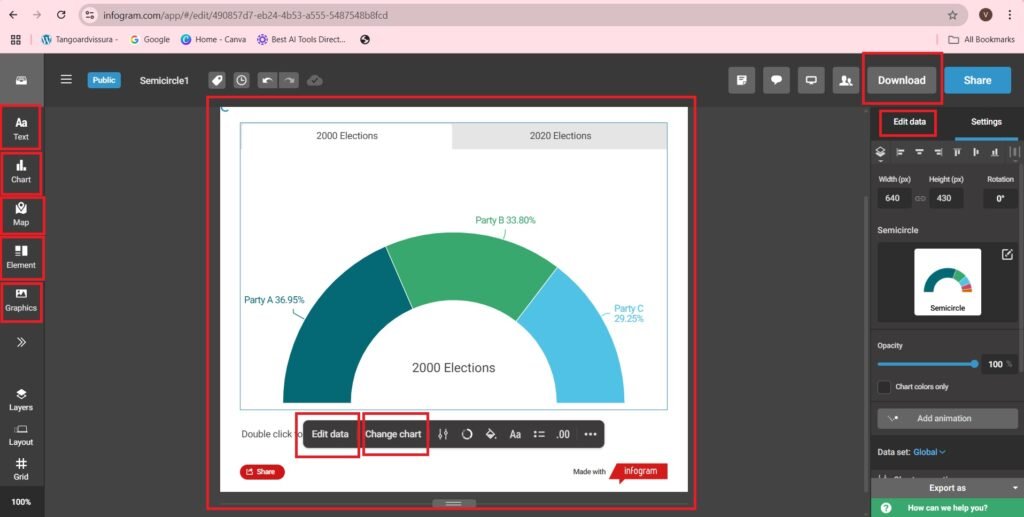
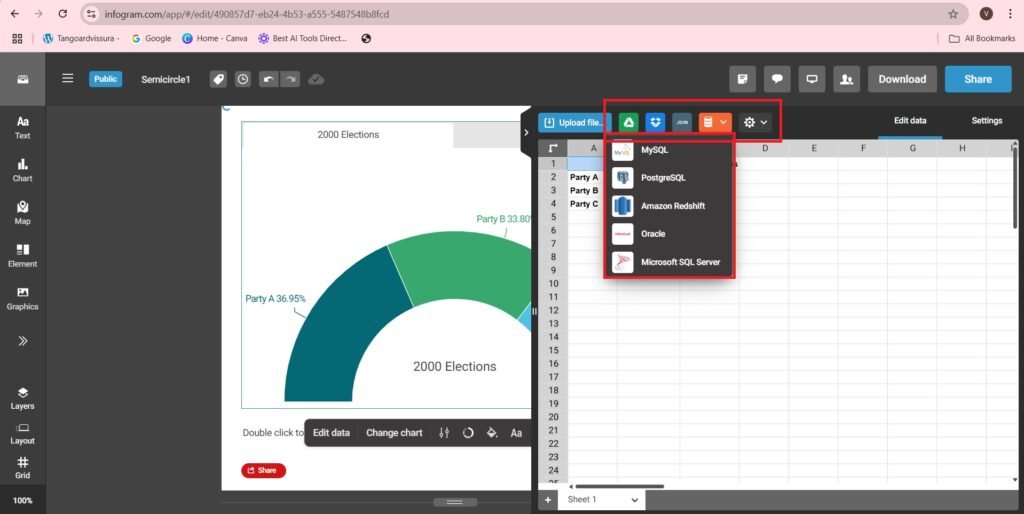
- There are plenty of editing options available. You can access the semicircle chart.
- The Text, Chart, Map, Element, Graphics can be easily added.
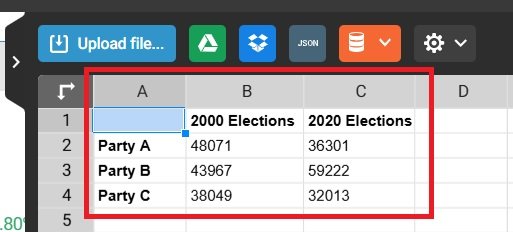
- You can even Edit Data.
- The data is as follows:-
- You can even, Add Google drive document, Add from drop box, Add JSON feed, you can even add MySQL, Postgre SQL, Amazon redshift, Oracle, Microsoft SQL server.
- Now I am going to edit data, as follows:-
- The New data is as follows:-
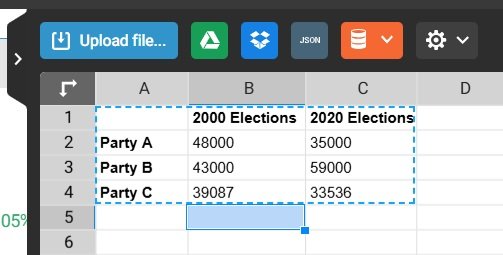
- If you compare the previous percentage in the semicircle to the percentage in the semicircle in the new one, of the screenshot, you will get a change their percentages of the data.
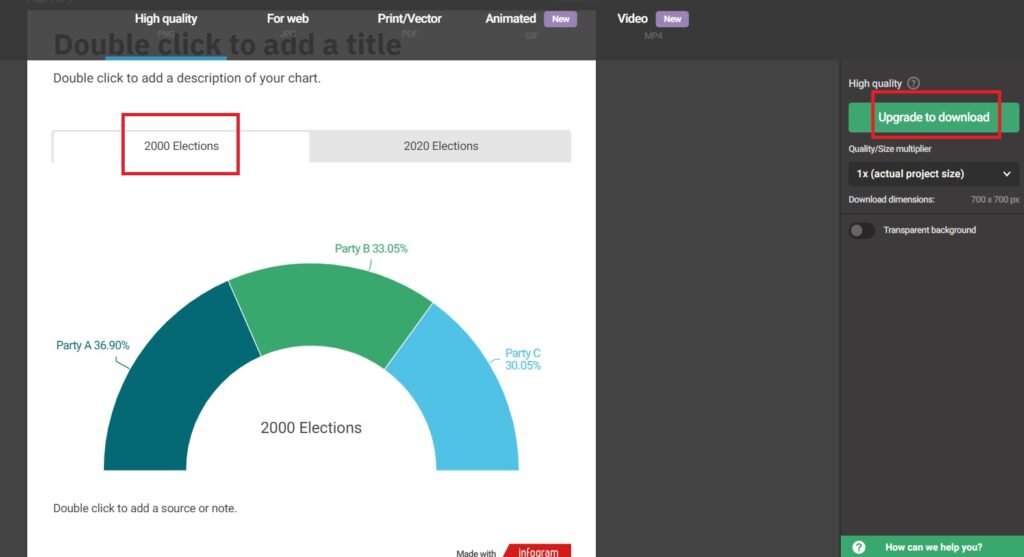
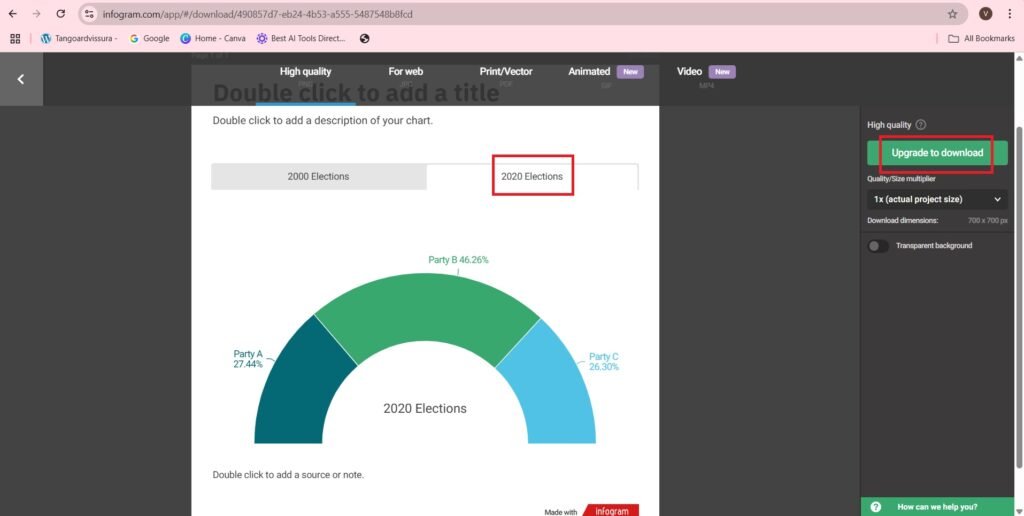
- You can access the semicircular chart. It requires upgradation.
- When we share and publish the content—>
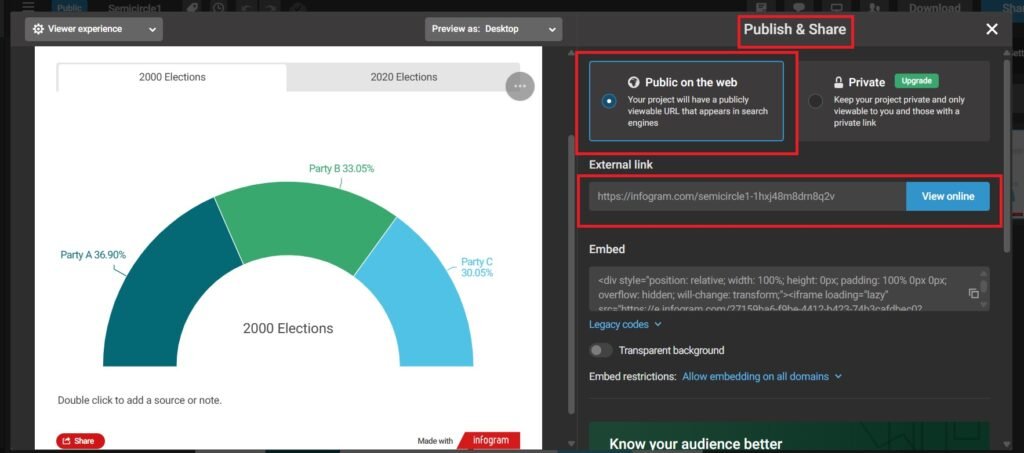
- The shared and published link is as follows:- https://infogram.com/semicircle1-1hxj48m8drn8q2v
- If you open the the above link, you will get to see the Chart—>
- Similarly you can do whatever you want, create infographics, access them and share it.
Sketching Intelligence: Crafting Visual Stories with Napkin.ai
Frequently Asked Questions(FAQs)
What is Infogram AI?
Infogram AI is an AI-powered tool designed to generate infographics such as charts, slides, maps, posters, dashboards, and social media.
Who can benefit from using Infogram AI?
Working professionals, businesses, marketers, tutors, and creators who need to visualize data efficiently.
What data sources are supported?
Google Drive, Dropbox, JSON feeds, MySQL, PostgreSQL, Amazon Redshift, Oracle, and Microsoft SQL Server.
Does Infogram AI offer paid plans?
Yes, affordable paid plans offer enhanced features and customization options.
Why should I use infographics instead of plain text?
Visuals like charts and graphs are easier to understand and more engaging than unstructured text.
How can Infogram AI help in teaching or marketing?
It makes concepts more persuasive and memorable, ideal for education, research, and digital marketing.