
My blogpost, ‘Sketching Intelligence: Crafting Visual Stories with Napkin.ai’, is a detailed narration of the following table:-
| Feature | Details |
|---|---|
| Purpose | Napkin.ai is an AI-powered tool that transforms text into visuals, aiding in effective idea sharing. |
| Functionality | Users input text, and Napkin.ai generates relevant visuals, which can be customized and exported. |
| Customization | Offers editing of content and style, including icons, decorators, connectors, colors, and fonts. |
| Export Options | Visuals can be exported in PNG, PDF, or SVG formats. |
| Use Cases | Ideal for presentations, blogging, social media content, documentation, and educational materials. |
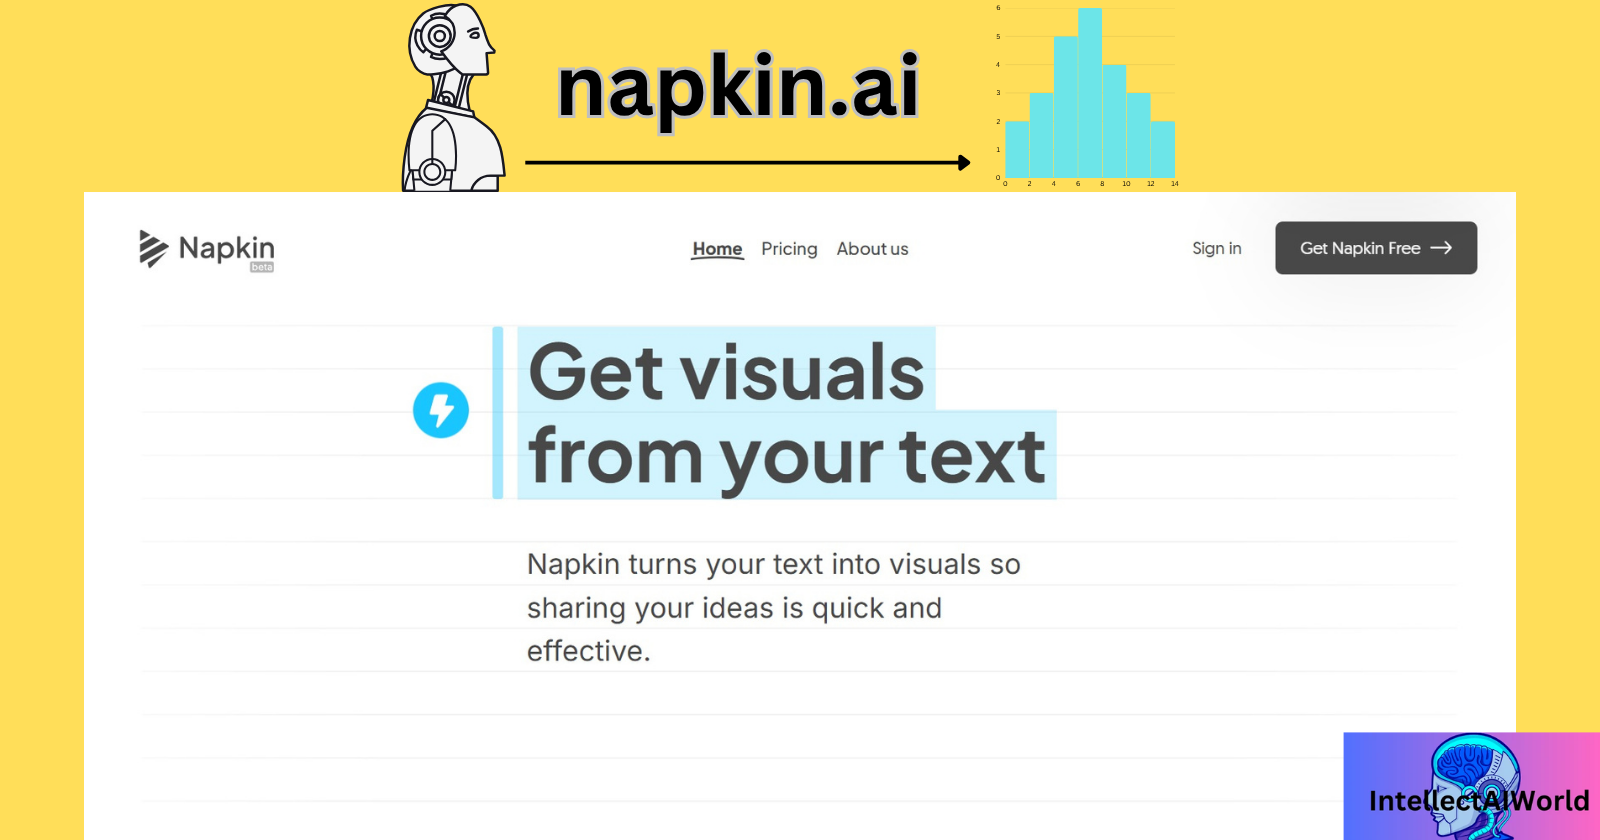
Napkin.ai
- Napkin.ai is an AI tool that is used to create compelling visual narratives of the raw data that is provided to it.
- The visual formats include infographics, conceptual diagrams, process flowcharts, and illustrative sketches.
- The export options include PNG, PDF and SVG for easy sharing. It also includes autogenerated infographics for presentations and blogs facilitating seamless integration.
- The AI tool also provides Business storytelling capability tools, to create logical structured diagrams and streamlined process maps and process flows., which enhance clarity and strategic communication.
- No there is no need to create diagrams, flowcharts and sketches sitting and editing for hours to create images, offering a swift and elegant solution for visual content creation.
- The tool is an alternative to Images(in the form of graphs, flowcharts and sketches) creation software and tools on the web. These software take time and human effort to create visuals and infographics.
- Adobe Photoshop, CorelDRAW, GIMP, Canva, Affinity Designer are photo editing and image editing software. Howevwer, they typically require hands-on expertise, considerable time investment, and a high degree of design proficiency to yield professional-grade results. The quality of output is often contingent upon the user’s artistic skill and familiarity with the software. It is time and effort-consuming. Additionally, the quality of the Images and Infographics depends on the individual’s ability. However, AI tools like Napkin.ai are an alternative to the above software, creating high-quality visuals.
- The AI tool Napkin.ai analyzes the data for you and gives its infographics in minutes. Its intuitive interface and extensive customization options make it accessible and appealing to users across various domains—from business analysts to educators and content creators.
- The platform’s dynamic visual outputs not only enhance the aesthetic presentation of data but also facilitate clearer communication and improved comprehension. By eliminating the need for prolonged manual design work, Napkin.ai empowers users to focus on storytelling and strategic insights rather than technical execution.
Uses of Napkin.ai
- The visuals created simplify complex data into easily digestible formats. It clarifies relationships between concepts in flowcharts and diagrams.
- The technical concepts could be easily understood using flowcharts and diagrams.
- It improves knowledge retention by engaging audiences visually. more audience is attracted towards visual representations and making blog posts, social media, and presentations more compelling.
- Data visualizations strengthen audience trust in research and analytics.
- Businesses use graphs for trend analysis and forecasting. Flowcharts improve process efficiency in project management.
- The AI tool provides step-by-step guides to improve skill acquisition in tutorials.
- Case studies benefit from clear graphical representations.
- You can easily upload data in the form of PDFs, blogs, presentations converted into visuals and infographics.
- The AI tool can make a great contribution to professionals, teachers, students of schools and colleges to understand easily graphs data in the form of graphs and visuals.
- Various academic studies can be easily managed and understood through data visuals.
- School and college-going students can benefit, as they can use the created mind maps, flowcharts and infographics as reference materials for their academic studies.
- The company meetings can benefit from the graphical representations, created in minutes, helping professionals to understand complex data and hence, grow in organization.
- You can quickly fix or change text right inside your presentation app, so you don’t have to keep switching between different programs. This makes your work easier and helps you finish faster.
Conclusion
- Various AI tools have made lives easy for all kind of audiences, globally.
- AI tools like napkin.ai will be configured and improve over time, and their usage will increase.
- The more data you provide, it will give you better and efficient results.
How to use Napkin AI for presentation and visuals?
The process of using napkin.ai is as follows:-
- Go to https://www.napkin.ai/ .
- You will navigate to the following page:-
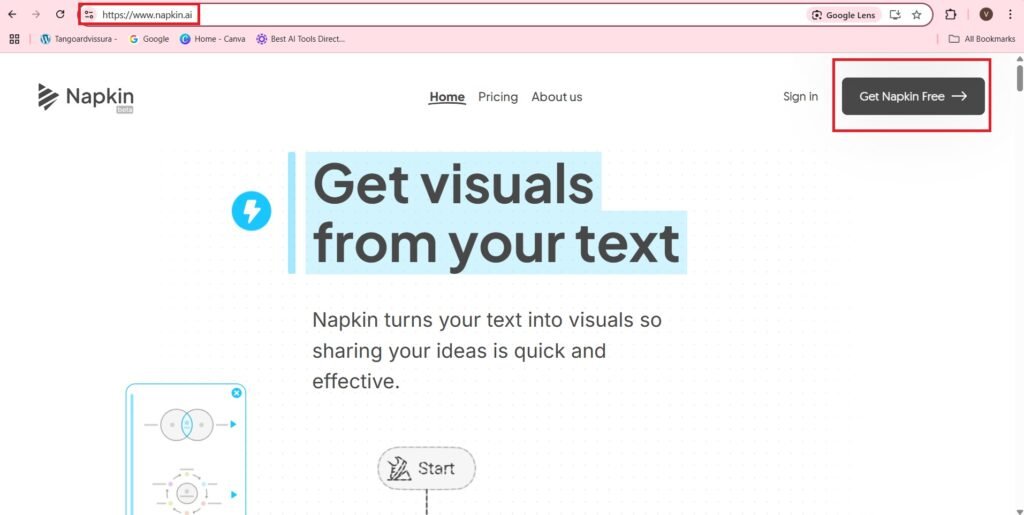
- Press—>Sign In with Google.
- You can Sign In with your Email.
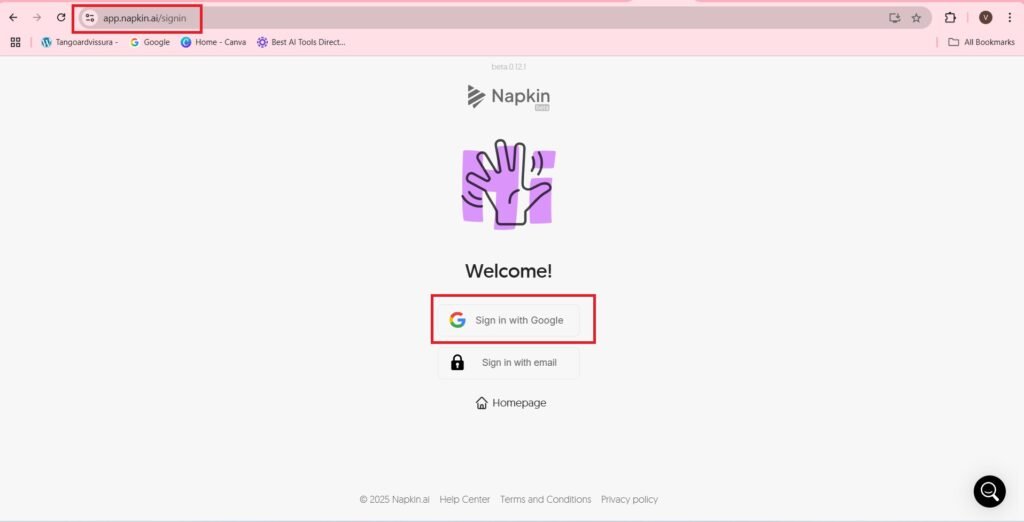
- Choose an Account,
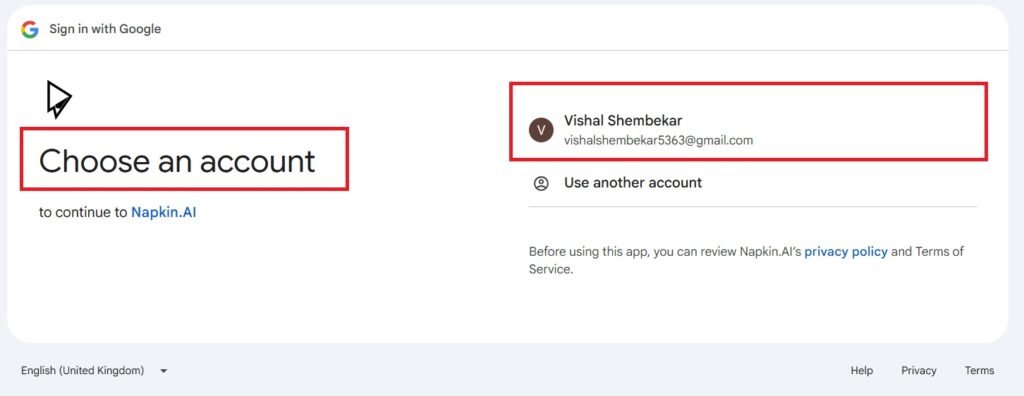
- Continue,
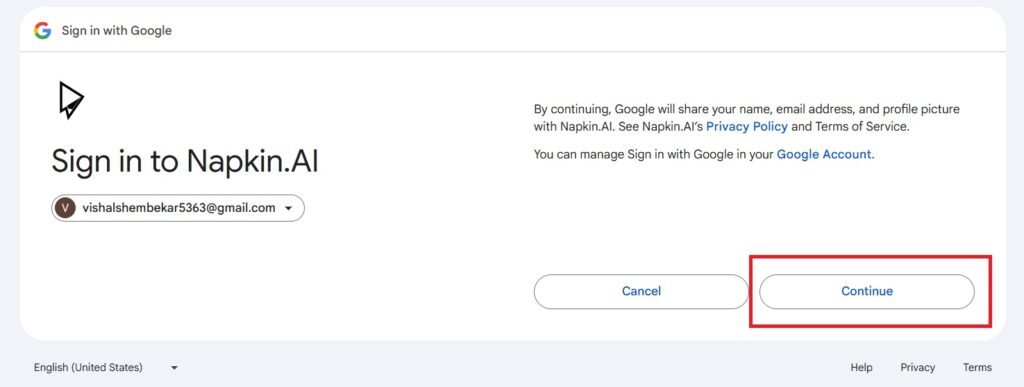
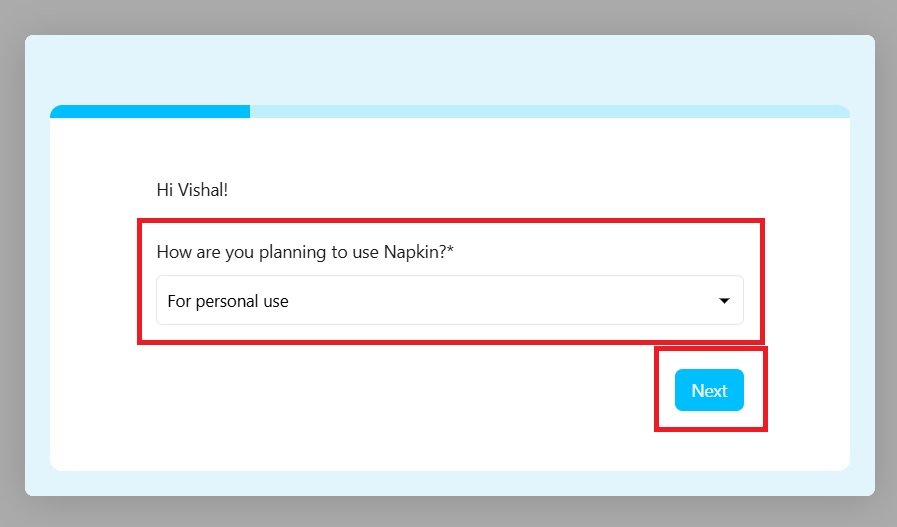
- Next,
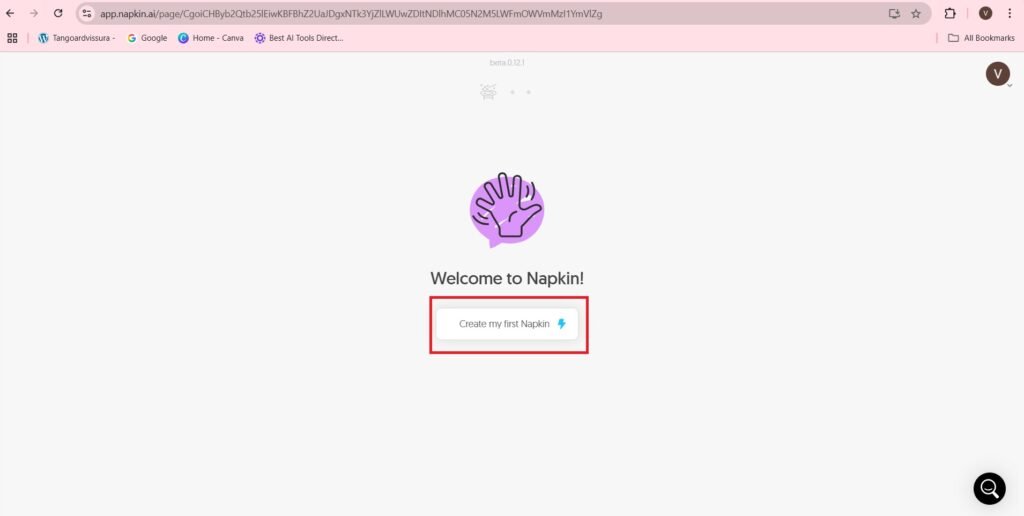
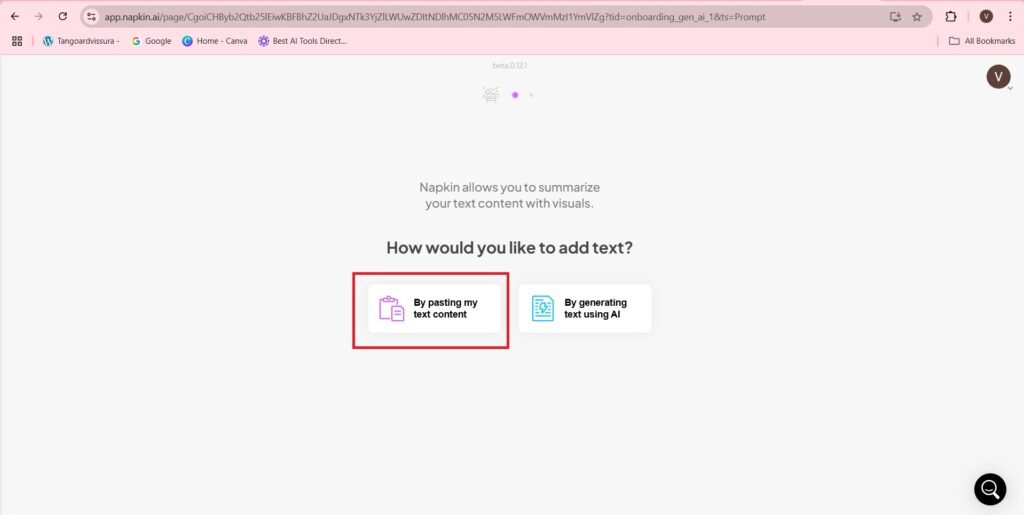
- You will navigate to the following page:-
- By Pasting my First content,
- I am pasting the following content:-
- ‘Muralitharan 800 Wickets
- Shane Warne 708 wickets
- James Anderson 704 wickets
- Anil Kumble 619 wickets
- Courtney Walsh 519 wickets
- Dale Styne 439 wickets
- Sir Richard Hadlee 431 wickets
- Wasim Akram 414 wickets
- Shaqib Al Hasan 237 wickets’
- The pasted content is as follows:-
- There is a ‘Blue button’ on the left side.—>’Generate Visual’
- Also there is an Untitled Region on the upper side, which is there to Give the Title of the visual.
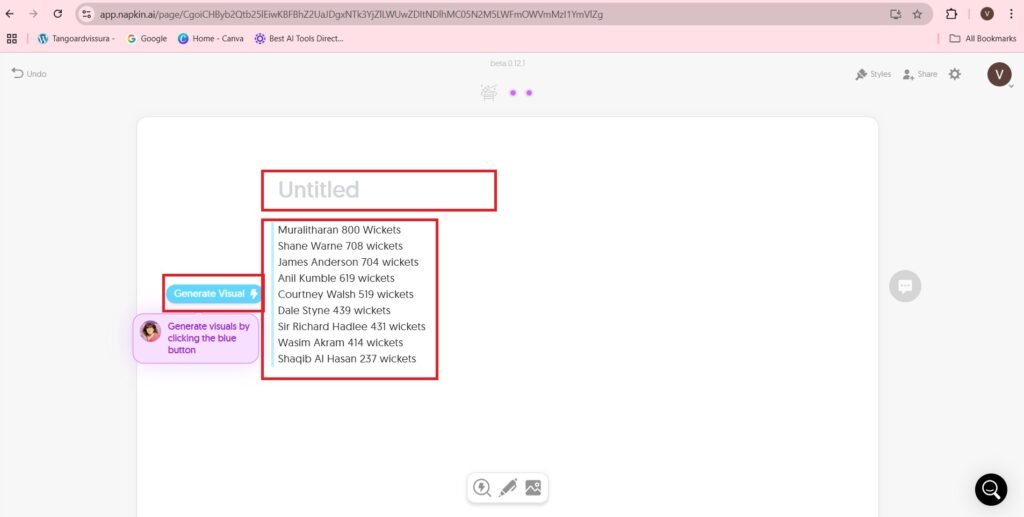
- The title is:- ‘Bowlers Test Wickets’
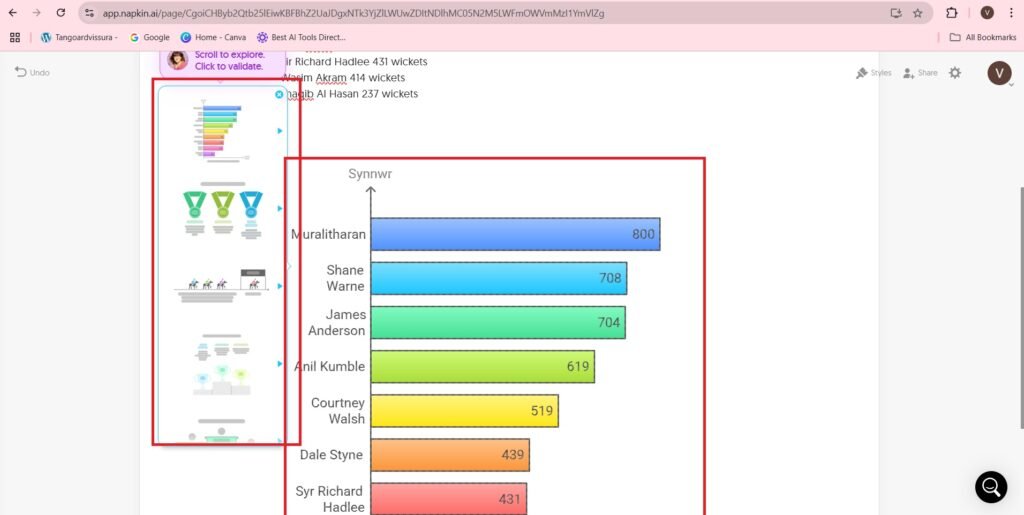
- The visuals are as follows:-
- Various visuals are shown on the left hand side of the window.
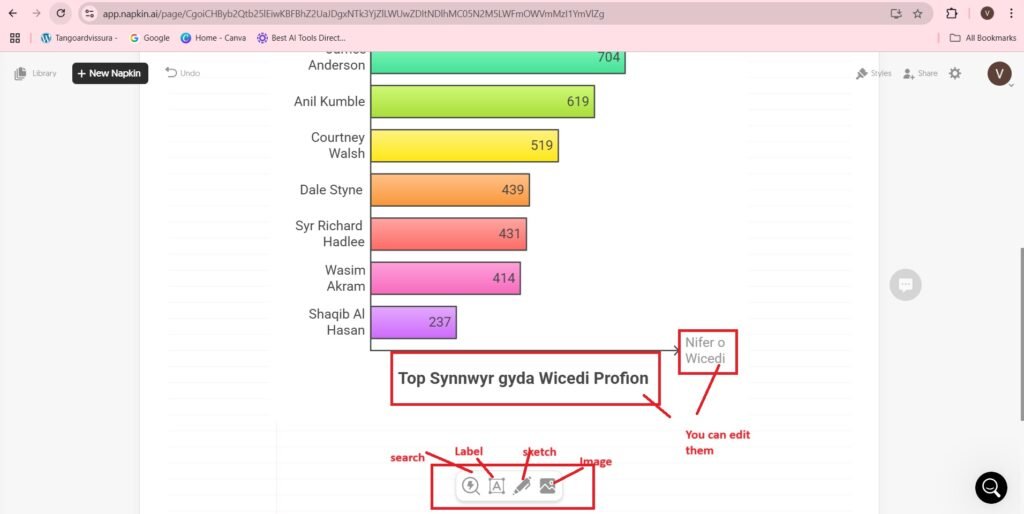
- You can click on the infographic to change its color and border. You can also add border to the infographic.
- The editing options are as follows:-
- When you hover the mouse over the top right corner of the page, there is an option to export the visual on the top right corner of the visual.
- Other options on the top right corner of the visual include, Change style, aspect ratio, Background color, Refresh.
- When you press, ‘Export’ option on the top right corner of the page the visual is exported.
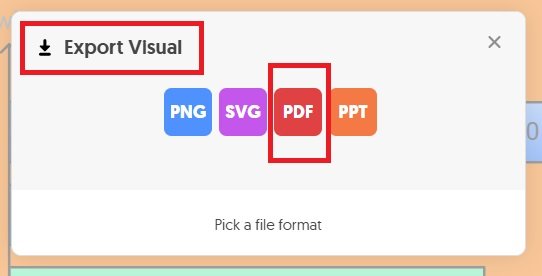
- You will get the following screen—>
- Select the options you want:-
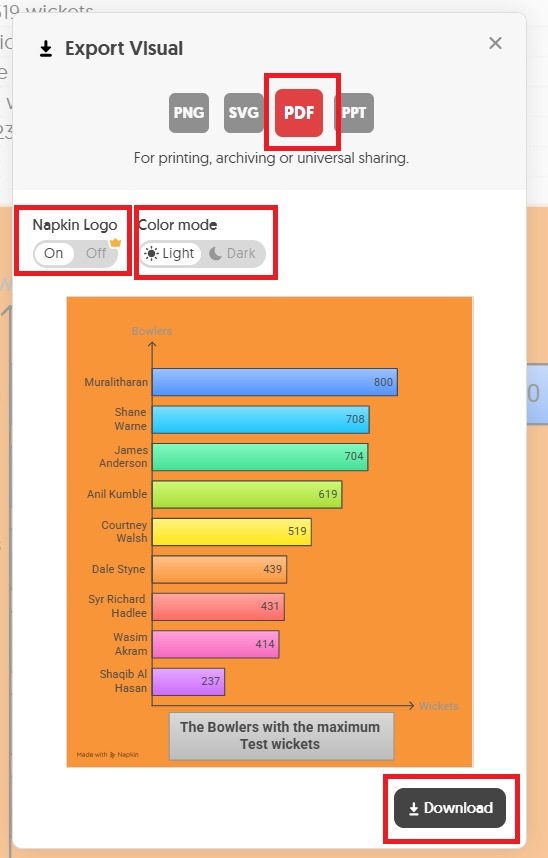
- The exported visual in PDF format is as follows:-
- I am using the above data of ‘Bowlers Test wickets’, to create a new visual of the data.
- The visual is generated and edited in the same manner as above—>
- The data is same, i.e.,
- Muralitharan 800 Wickets
- Shane Warne 708 wickets
- James Anderson 704 wickets
- Anil Kumble 619 wickets
- Courtney Walsh 519 wickets
- Dale Styne 439 wickets
- Sir Richard Hadlee 431 wickets
- Wasim Akram 414 wickets
- Shaqib Al Hasan 237 wickets
- The visual created is as follows:-
- Now its time to create a visual by uploading a document like PDF.
- The PDF to be uploaded is as follows:-
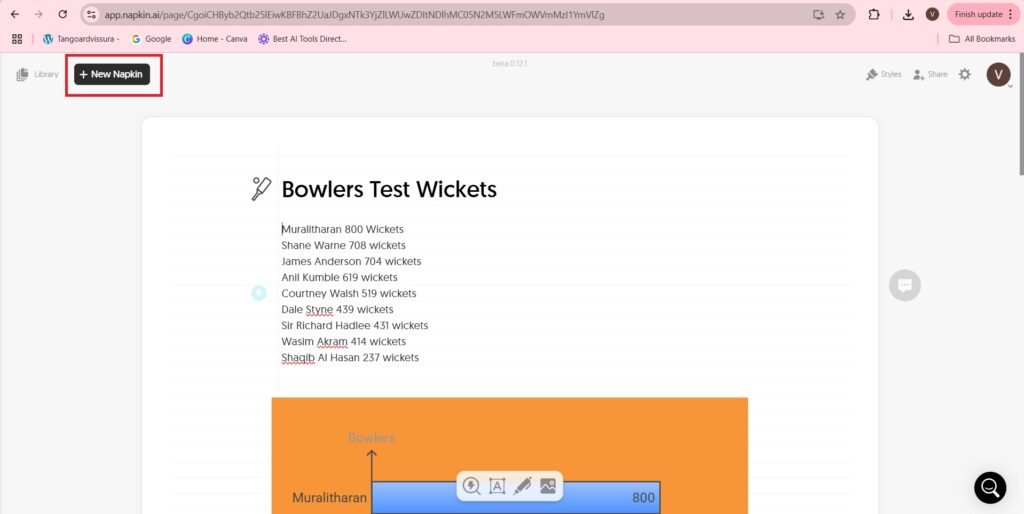
- Take a New Napkin—>
- When you Press the New Napkin button, you will get three options:-
- Draft with AI
- Import from file
- Blank Napkin
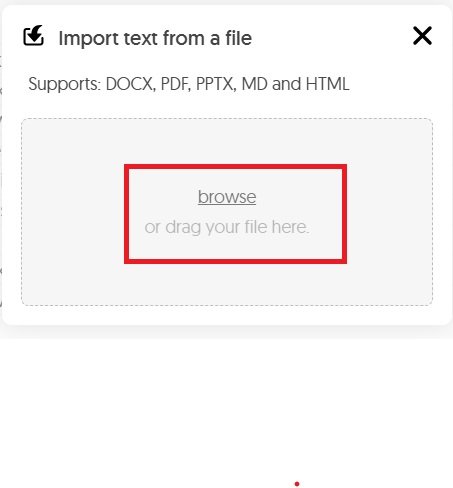
- Press—>Import from file
- Import the file as PDF:-
- The Imported file is part of the Library as shown:-
- Press the blue button on the left of the data to create visuals—>
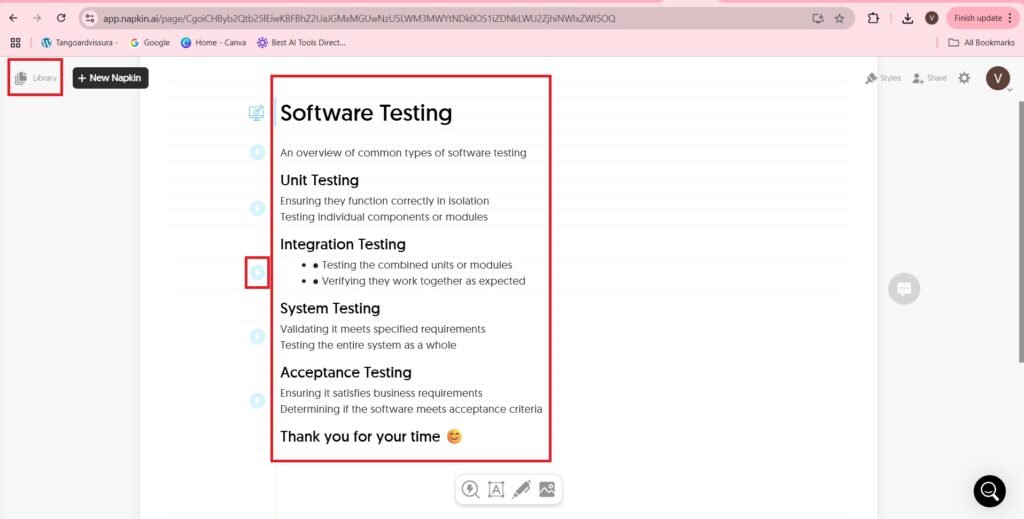
- I am creating a visual of the data,
- ‘Unit Testing
- Ensuring they function correctly in isolation
- Testing individual components or modules’
- It is shown as follows:-
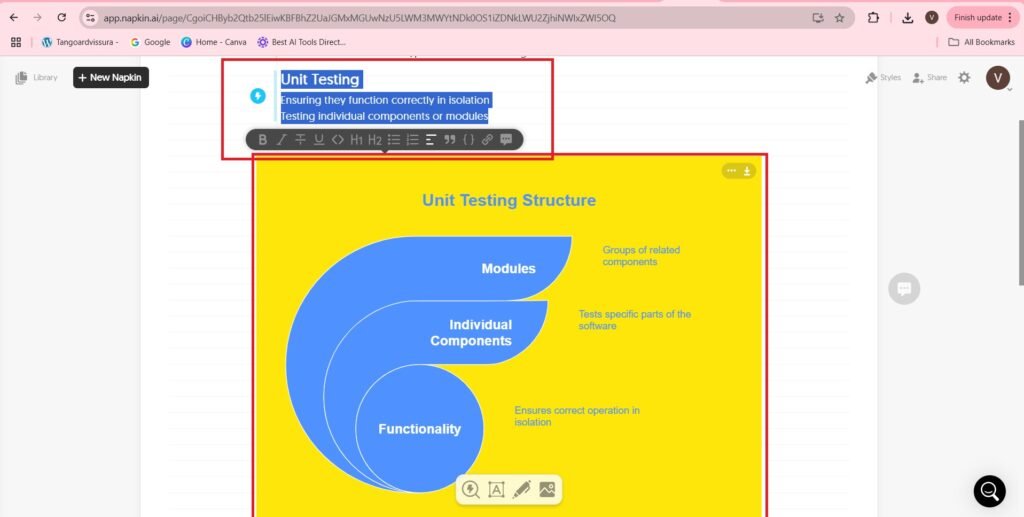
- The visual is created and edited in the same manner as above.
- The visual created is as follows:-
Official page of napkin.ai on LinkedIn
- The number of followers of Napkin.ai is 12K followers.
Infographics Reimagined: Inside the Mind of Infogram AI
Frequently Asked Questions(FAQs)
What is Napkin.ai?
Napkin.ai is an AI-powered tool that transforms your text into visuals such as diagrams, charts, scenes, and images. It’s designed to help you communicate ideas more effectively by turning written content into engaging graphics.
Is Napkin.ai free to use?
Yes, Napkin.ai offers a free plan with some limitations on usage quotas and customization features. During the beta period, users can enjoy access to the Pro plan for free, providing an opportunity to explore all advanced tools and features without any cost.
How do I create visuals with Napkin.ai?
Simply paste your text into Napkin.ai, and the platform will generate relevant visuals based on your content. You can then choose the visual that best represents your idea.
Can I guide Napkin.ai to generate a specific type of visual?
While Napkin.ai doesn’t allow manual selection of specific visual types, you can influence the output by adding descriptive hints at the beginning of your text. For example, starting with “Chart:” or “Diagram of…” can guide the AI toward the desired visual style.
Can I use custom colors in my visuals?
Yes, Napkin.ai allows you to use custom colors by adding them in hex format. This feature helps maintain brand consistency or match your preferred color scheme when creating visuals.
Are the visuals created with Napkin.ai free from copyright issues?
Absolutely! The visuals generated by Napkin.ai are not subject to copyright, meaning you have the freedom to use them on your website, social media, presentations, books, or any other platform without restrictions.
Can I use Napkin.ai on mobile devices?
Napkin.ai visuals can be viewed on mobile devices. However, the best editing experience is on desktop, where you have full access to text input and visual editing tools.
Does Napkin.ai support team collaboration?
While team collaboration isn’t the primary focus, Napkin.ai offers features that support collaborative work. Multiple users can edit a Napkin in real-time, and built-in commenting tools facilitate feedback on text and visuals.
What export options are available for the visuals?
You can export your visuals as PNG, SVG, or PDF files. Additionally, you can export the entire document into a PDF or share a link to your Napkin, allowing others to view your text and graphics integrated together.
Does Napkin.ai offer an API or offline usage?
As of now, Napkin.ai does not offer an API or support offline usage. The platform is designed to work online to provide real-time visual generation and editing capabilities.